Debugging and Troubleshooting
This section provides information on how to debug and troubleshoot operating issues for the Solace Geneos Agent.
Monitoring Solace Geneos Agent Health
The Solace Geneos Agent’s health and performance depend on the following factors:
- the state of the event broker
- the state of the Netprobes and the number of Netprobes
- the number of data views
- the sampling rate of the data views
- the quantity of data being returned from the event broker to populate the data views
If the agent is not performing due to one or any of these factors, the problem will manifest itself as one of the following:
- missed interval—A data view was scheduled to collect and report data but could not because it had not finished its previous collection/reporting cycle.
- aborted interval—An error occurred during data collecting or reporting.
Two default data views are created to make information such as missed intervals and abort intervals available to administrators, so that the agent’s health can be properly monitored: MonitorStatus and ServiceStatus. By default, these data views are not enabled.
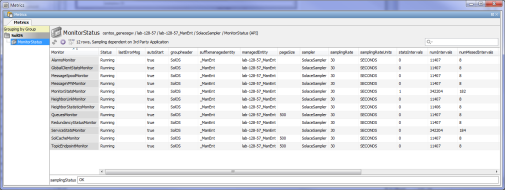
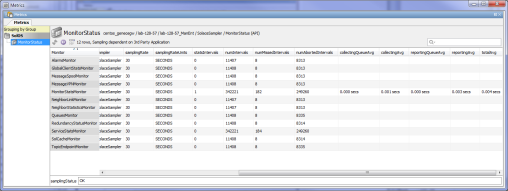
MonitorStatus
MonitorStatus data view displays statistics collected from all the monitors loaded by the agent. Each monitor shows up as one row in the table. The statistics supported are:
- monitor class name, monitor status
- properties loaded from global and monitor specific property file, such as
autoStart,pageSize,samplingRate,statsIntervals numIntervals,numMissedIntervals,numAbortedIntervals. These statistics represent the successful, missed, and aborted collect/report cycles. WhennumMissedIntervalsandnumAbortedIntervalsincrement for a monitor, it indicates the monitor is not behaving properly.collectingQueueAvg,collectingAvg,reportingQueueAvg,reportingAvg,totalAvg. These statistics represent the average time it takes at different stages of a collect/report cycle. The changes in these statistics can effectively indicate whether the monitor is slowing down, falling behind, or performing normally.lastErrorMsg. The last error that caused missed interval or aborted interval.
The following snapshots from ActiveConsole show the full span of available statistics collected for each monitor:
ServiceStatus
The ServiceStatus data view displays statistics collected from each service: Event broker service, Netprobe services, and Solace Geneos Agent service. The statistics supported are service name, state, currentTimeInState, lastErrorMsg, and timesDown.
The following snapshot from ActiveConsole shows the statistics collected for each Solace Geneos Agent service:
![]()
Enabling Data Views
By default, both the MonitorStatus and ServiceStatus data views are disabled. To enable them, do the following:
- In
MonitorStatsMonitor.propertiesorServiceStatsMonitor.properties, setsamplingRateto a value greater than 0, and setautoStartto true. - To see how much time a view is taking, set
statsIntervalsto a value greater than 0 in the specific monitor properties file. For example, for Users view, inUsersMonitor.properties, setstatsInterval=1. - Restart the Solace Geneos Agent.
JMX Support
The Solace Geneos Agent allows registration of services and monitors with the JMX agent that is bundled with Java Runtime. Each service and monitor has an MBean associated with it. These MBeans are created and registered with JMX agent’s MBean server automatically when the monitors and services are initialized. Specifically for monitors, the BaseMonitor class’ initialize() method creates the monitor’s MBean and registers the MBean with MBean Server. Therefore, user‑developed monitors get JMX support.
JMX support is meant as a debugging and performance tuning tool at the development stage. Therefore, it is disabled by default.
To enable JMX, do the following:
- Edit the
servicescript.sh(located insolgeneos/currentload/bin), and add the ‘$JMX_OPTS’ option to thePROGvariable.Specifically, in the
setenv()function change the line:PROG="$_JAVA_HOME/bin/java -cp $LOCALCLASSPATH $SOLACE_OPTS $MAIN_CLASS"
To:
PROG="$_JAVA_HOME/bin/java -cp $LOCALCLASSPATH $JMX_OPTS $SOLACE_OPTS $MAIN_CLASS"
- Make sure to add the management IP address to hostname mapping to file
/etc/hosts; for example:10.10.10.10 appliance-hostname-10
To access the JMX agent, launch JConsole provided by the Java Runtime, and point the JConsole to the remote process where JMX is running. In the case of Solace Geneos Agent, it should be
managementIP:<jmx remote port>.
From a JMX console, you also have the ability to start/stop monitors, start/stop/reset/view statistics, and view/modify certain properties.
For example, to change samplingRate for UsersMonitor from JMX, do the following:
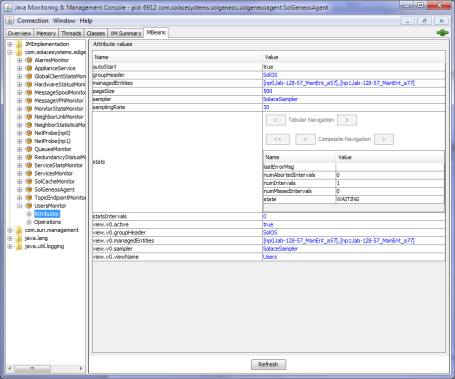
- In the left tree view of the JConsole, select UsersMonitor > Attributes.
- In the right panel, enter a new value for the samplingRate attribute.
- In the left tree view, select UsersMonitor > Operations.
- To restart the monitor, click the Stop button, then the Start button.
Logging
The Solace Geneos Agent uses the standard apache commons logging interfaces to support logging functionality. The log4j.properties is bundled with the agent distribution and is placed under /usr/sw/solgeneos/config directory during installation. By default, the agent logs are output to the /usr/sw/solgeneos/logs directory. If custom monitors are deployed, each java package will require a line in the log4j file, of the form:
log4j.category.<package name>
or, for example:
log4j.category.com.solacesystems.solgeneos.sample=INFO
For information on how to modify log4j.properties, refer to https://logging.apache.org/log4j/2.x/javadoc.html.