Monitoring Your Agent Mesh
Operating an Agent Mesh deployment day-two means watching three streams: operational logs (structured output covering startup, request handling, event broker activity, and errors), metrics (OpenTelemetry histograms and counters for entrypoint latency, large language model (LLM) duration, token usage, and tool execution), and traceID correlation so a single user task can be followed across the Entrypoint Executor, the Agent-Workflow Executor, the Secure Tool Runtime, and tool boundaries.
Agent Mesh runs the OpenTelemetry SDK in-process and exposes a Prometheus /metrics endpoint plus optional OpenTelemetry Protocol (OTLP) exporters for shipping metrics and logs to an external aggregator (OpenTelemetry Collector, Datadog, New Relic, Grafana Cloud, and similar). It does not run a metrics backend, a long-term log store, or a distributed-tracing collector — those are aggregator concerns. The audit channel — the closed, security-relevant log stream — has its own page; see Managing Audit and Compliance.
Deploy-time wiring (scrape configs, health probes, and log collectors) lives in Monitoring Your Deployment. This page covers what to read on the dashboards once those pipes are in place.
Operational Logs
Agent Mesh writes structured logs to stderr by default. The shape is controlled by the optional log: block read from the root of each component's runtime config — it is process-level, not per-agent. The same keys are read by the sam CLI, the Entrypoint Executor, Agent-Workflow Executor, and Secure Tool Runtime, and the Platform service. On a Platform or Solace Cloud deployment, agents are deployed into a shared Agent-Workflow Executor, so the log: block governing them lives on that process's config, not on any individual agent file. Point LOGGING_CONFIG_PATH at a standalone file (below) to apply one policy across every component.
# logging.yaml - point LOGGING_CONFIG_PATH at this; applies to every component
log:
  format: json
  stdout_log_level: INFO
  log_file_level: INFO
  log_file: /var/log/sam/agent.log
  max_size_mb: 50
  max_backups: 10
  max_age_days: 30
  compress: true
Recognized keys and their defaults:
| Key | Default | Notes |
|---|---|---|
format
|
json
|
text for human-readable local dev, json for any aggregator. Case-insensitive. |
stdout_log_level
|
INFO
|
Stderr threshold: DEBUG / INFO / WARNING / WARN / ERROR / CRITICAL. An omitted or unrecognized value resolves to INFO. |
log_file_level
|
INFO
|
File threshold (only used when log_file is set). An omitted or unrecognized value resolves to INFO. |
log_file
|
unset (stderr only) | Absolute path. When set, records fan out to stderr and the file. |
max_size_mb
|
0 (no rotation) |
Rotation trigger in MiB. 0 grows the file unbounded with a startup warning. |
max_backups
|
10
|
Backups to keep. Explicit 0 = unlimited (audit/compliance). |
max_age_days
|
0 (forever) |
Maximum age of rotated backups, in days. |
compress
|
false
|
Gzip rotated backups. |
If a level is spelled in a way the runtime doesn't recognize, it falls back to INFO and prints a warning to stderr at startup.
Every value supports ${VAR, default} environment substitution, so you can drive any of these keys from the environment without editing YAML — for example stdout_log_level: ${SAM_STDOUT_LOG_LEVEL, INFO}. Any such SAM_LOG_* names are a naming convention you choose, not built-in overrides. The one setting with a hardcoded override is format: the LOG_FORMAT environment variable wins even when the YAML sets format: explicitly.
Set LOGGING_CONFIG_PATH to point at a standalone YAML file when you want one logging policy across every component — its log: block fully replaces the per-app block. The file shape matches the log: block above: a single top-level log: key followed by the same fields. The runtime prints a logging configured from LOGGING_CONFIG_PATH line to stderr at startup so an operator can confirm the active file even when stdout_log_level is WARNING or higher.
Raise a threshold to DEBUG only while you are actively debugging, and prefer stderr over the file when you do. The DEBUG level adds per-message diagnostics, including the tail end of what a tool writes to stderr. When log_file_level is DEBUG, the runtime writes those diagnostics to disk and keeps them for as long as your rotation settings allow.
Log attribute values pass through a defense-in-depth redaction pass before they reach any handler: keys matching password, client_secret, api_key, token, or credential (with an optional _ prefix) emit [REDACTED] in place of the value. Treat this as a safety net, not a substitute for not logging the secret in the first place — keys outside the pattern (url, DSN-style fields) still pass through verbatim. See Managing Secrets for the redaction contract in full.
Metrics
The runtime exposes a Prometheus /metrics endpoint backed by the OpenTelemetry Go SDK. Metrics are off by default — zero overhead, no endpoint. Enable them on any component by adding the management_server.observability block:
# Entrypoint Executor config
...
management_server:
  port: 9090            # /health, /ready, and /metrics all listen here
  observability:
    enabled: true
    metric_prefix: sam
    path: /metrics
...
metric_prefix defaults to sam and path defaults to /metrics; both fields are optional.
/metrics is served by each workload's dedicated management server — the same listener as the /health and /ready probes, not the entrypoint's request-path port. management_server.port (a sibling of observability:, not nested under it) sets that listener; an explicit --health-addr flag overrides it, and with neither set each binary falls back to its default: the Entrypoint Executor :9090, the Platform service :9091, the Agent-Workflow Executor :8090, the Secure Tool Runtime :8090 (a single :8090 in single-process mode — see Health Endpoints below). Point your scrape job at that management port, not the API listener.
Built-In Instruments
Every metric name is prefixed (sam. by default) and follows OpenTelemetry semantic-convention naming; durations are reported in seconds.
| Metric | Kind | Where it fires | Notable labels |
|---|---|---|---|
sam.operation.duration
|
histogram | Agent task and tool execution | type=agent\|tool, component.name, operation.name, error.type |
sam.gen_ai.client.operation.duration
|
histogram | LLM client calls | gen_ai.request.model, error.type |
sam.gen_ai.client.operation.ttft.duration
|
histogram | Time-to-first-token for streaming LLM responses | gen_ai.request.model
|
sam.gen_ai.tokens.used
|
counter | LLM token accounting (input/output split) | gen_ai.request.model, gen_ai.token.type, component.name |
sam.gen_ai.cost.total
|
counter | Estimated LLM cost per model | gen_ai.request.model
|
sam.entrypoint.duration
|
histogram | HTTP request duration on the entrypoint | entrypoint.name, operation.name, error.type |
sam.entrypoint.ttfb.duration
|
histogram | HTTP time-to-first-byte for streaming entrypoint endpoints | entrypoint.name, operation.name |
sam.entrypoint.requests
|
counter | HTTP request count | entrypoint.name, route.template, http.method, error.type |
sam.outbound.request.duration
|
histogram | Outbound calls (artifact backends, peer-routing proxy, Teams/Slack APIs) | service.peer.name, operation.name, error.type |
Histogram bucket boundaries are configurable per-metric under management_server.observability.distribution_metrics. The defaults are tuned for typical latency ranges — for example, sam.entrypoint.duration buckets at [0.01, 0.05, 0.1, 0.25, 0.5, 1.0, 2.5, 5.0, 10.0, 30.0, 60.0] seconds and sam.gen_ai.client.operation.duration at [0.5, 1.0, 2.0, 5.0, 10.0, 20.0, 30.0, 60.0, 120.0]. Override the buckets, or drop labels to control cardinality, without removing the metric:
# Entrypoint Executor config
...
management_server:
  observability:
    enabled: true
    distribution_metrics:
      entrypoint.duration:
        buckets: [0.05, 0.1, 0.5, 1.0, 5.0]
      operation.duration:
        exclude_labels: ["*"]    # turns this metric off without removing the YAML
...
Distributed-tracing spans are not emitted today — use traceID correlation instead (next section).
Trace ID Correlation
Every user task carries an immutable UUIDv7 traceID minted by the Entrypoint Executor the moment the task is submitted. The same value is forwarded at every subsequent hop — event broker user-properties, agent task loop, peer-agent delegation, Secure Tool Runtime dispatch, and tool context — so one identifier spans the entire causal chain. Built-in tools see the same traceID on the tool context they receive.
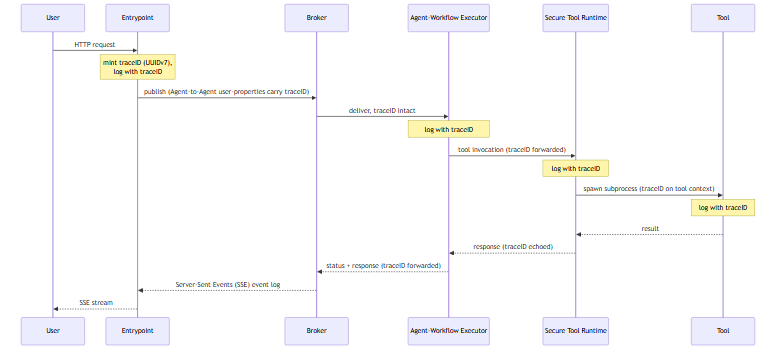
The log field name is traceID (camelCase), emitted by the Entrypoint Executor, Agent-Workflow Executor, and Secure Tool Runtime and by the tool layer at every meaningful hop. A single grep surfaces the full causal chain of a task:
grep 'traceID=01972c40-d3c8-7c8b-a6c7-3f8c1f0c8f63' /var/log/sam/*.log
In Datadog Logs the equivalent query is @traceID:01972c40-d3c8-7c8b-a6c7-3f8c1f0c8f63 (or whichever attribute key your JSON log pipeline produces). The point of the immutable traceID is that one search across the Entrypoint Executor, Agent-Workflow Executor, and Secure Tool Runtime — and the tools themselves — returns a complete trail without joining identifiers.
What traceID is not:
-
Not a distributed-tracing span. There is no parent/child relationship, no W3C trace-context propagation, and no OTel APM linkage today.
-
Not in the audit-channel schema. Audit records carry
task_idandsession_idfor correlation; the operationaltraceIDis a separate identifier that lives on operational logs only. See the closed audit schema in Managing Audit and Compliance. -
Not re-minted on republish. The same UUID survives every hop until the task completes.
If you build alerts that need cross-process correlation, alert on the operational stream and pivot to traceID for the drill-down query.
Health Endpoints
Two kinds of health endpoint serve different needs:
-
Entrypoint proxy
/health— the entrypoint's request-path listener (typically:8800) responds toGET /healthwith200 OKand a plain-textokbody, unconditionally, as long as the listener is up. Use this for cheap external liveness checks (load-balancer health probes, smoke tests). -
Dedicated health server
/healthand/ready— every workload runs an independent health server on its own port that returns a component-aware JSON envelope suitable for a liveness/readiness probe:curl -fsS http://localhost:8090/health
{"status":"healthy"}A failed check returns
{"status":"unhealthy","error":"component <name> unhealthy: <cause>"}with status503 Service Unavailable.GET /readyreturns areadyboolean alongside achecksmap (runtime phase and event broker state) — for example{"ready":true,"checks":{"phase":"running","broker":"connected"}}— and returns503until the runtime reaches the running phase with a live event broker.
The /health envelope carries only those two values, but the Agent-Workflow Executor classifies its agents and workflows into three outcomes before it answers. It answers 200 OK with {"status":"healthy"} when every instance is serving, or when none is configured. It answers 503 when no configured instance is serving at all, so a genuinely dead workload is still restarted. In between, when some instances stopped serving and at least one still serves, it answers 200 OK with {"status":"healthy"} again. That third outcome is deliberate: it stops a single failed agent from crash-looping a pod that is still serving its other agents.
{"status":"healthy"} from the Agent-Workflow Executor does not mean every agent is serving. One agent that never came up, or that stopped serving, leaves both the body and the HTTP status unchanged, so no liveness or readiness probe detects it. /ready does not help either: it reports the lifecycle phase and the event broker connection, never per-agent health.
Three signals detect that case, and none of them is the probe:
-
The log. Each instance that fails to come up writes an
ERRORrecord with the messageinstance failed to initialize; it will not serveorinstance failed to start; it will not serve, carryingnameandkindfields. Theinstances startedrecord carriesstarted,attempted, andconfiguredcounts;startedlower thanattemptedis always a failure, andstartedlower thanconfiguredmeans either a failure or a deliberately disabled instance. -
The agent list. An agent that never starts never publishes an agent card, so it never appears in
GET /api/v1/agentCardson the entrypoint. An agent that stops serving later is removed from that list 2 to 3 minutes after its last heartbeat: the entry expires 120 seconds after the last heartbeat, and the check that removes it runs every 60 seconds. An agent that is in your configuration but absent from the list, on a workload still answering200 OK, is the case this callout describes. -
The metrics.
sam.component.countcarries one series per running agent, taggedtype=agentandname=<agent>. An isolated agent drops its series, whilesam.instance.upfor that workload (taggedcomponent_type=AWE) keeps reporting1. Alert on the missingnameseries rather than on the probe.
A split deployment gives each workload its own management port. The binary defaults are the Entrypoint Executor :9090, the Platform service :9091, the Agent-Workflow Executor :8090, and the Secure Tool Runtime :8090. The Agent-Workflow Executor and Secure Tool Runtime share the same :8090 default, so when you co-locate them give one an explicit --health-addr (or management_server.port) to avoid a bind collision. In single-process mode a single :8090 health server speaks for every component. Point probes at the per-workload management port rather than the request-path listener — a 503 there names the component that is sick, which the request-path ok body never does.
Shipping to Your Aggregator
Whatever metrics/logs aggregator you run, the bridge is one of three patterns: Prometheus scrape, OTLP push (metrics, logs, or both), or a stderr-capturing log driver.
Prometheus Scrape
Enable management_server.observability (above) and point a scrape job at the workload's management port — the same port as its health probes (:9090 for the Entrypoint Executor), not the request-path listener. Histograms appear under their full prefixed names — sam_operation_duration_seconds, sam_entrypoint_duration_seconds, and so on (the Prometheus exporter renames dots to underscores and appends the unit suffix).
# prometheus.yaml
scrape_configs:
  - job_name: sam-entrypoint
    metrics_path: /metrics
    static_configs:
      - targets:
          - sam-entrypoint.example.internal:9090
OTLP Push
management_server.exporters is a list that sits as a sibling to observability (not nested under it). Each entry chooses one OTLP target and opts in to metrics, logs, or both. Log exporters work even when observability.enabled: false — the two surfaces are independent.
# component runtime config
...
management_server:
  port: 9091            # /health, /ready, and /metrics listener
  observability:
    enabled: true
    metric_prefix: sam

  exporters:
    - type: otlp
      endpoint: http://otel-collector.observability.svc:4318
      protocol: http
      compression: gzip
      metrics: true
      logs: true
      log_level: INFO
      timeout: 10
...
Per-entry schema:
| Field | Required | Default | Notes |
|---|---|---|---|
type
|
yes | — | Only otlp is accepted today. |
endpoint
|
yes | — | Auto-suffixed with /v1/metrics or /v1/logs (HTTP) when the path is missing. |
protocol
|
yes | — | http or grpc. |
metrics
|
no | false
|
Opt-in. |
logs
|
no | false
|
Opt-in. Independent of observability.enabled. |
log_level
|
no | INFO
|
One of DEBUG, INFO, WARNING, ERROR, CRITICAL. Per-exporter. |
headers
|
no | none | Map of string → string. Use ${VAR} for secrets. |
timeout
|
no | 10
|
Seconds. |
compression
|
no | none
|
none or gzip. The YAML parser accepts deflate but both the HTTP and gRPC OTLP exporters reject it — deflate falls back to none with a warning. Use gzip when you want compression. |
insecure
|
no | false
|
gRPC only — turns off TLS. Mutually exclusive with certificate_file. |
certificate_file
|
no | unset | gRPC only — PEM CA bundle for the OTLP endpoint. |
For the TLS knobs on gRPC exporters (insecure, certificate_file), see Configuring TLS. Metrics export on a 60-second cadence; logs batch through the standard OTel SDK log processor. When the endpoint host matches datadoghq.com or datadoghq.eu, the exporter automatically switches counters and histograms to delta temporality (matching Datadog's cloud-intake contract). Multiple entries are allowed — each can ship to a different backend or filter to a different level.
Datadog
# component runtime config
...
management_server:
  observability:
    enabled: true

  exporters:
    - type: otlp
      endpoint: https://api.datadoghq.com
      protocol: http
      headers:
        DD-API-KEY: ${DD_API_KEY}
      metrics: true
      logs: false
      compression: gzip
...
Set log.format: json on every component so the Datadog Agent's log collector parses structured records and the traceID field becomes queryable as @traceID. The OTLP exporter handles metrics; logs typically flow via the Datadog Agent reading container stdout/stderr (no second OTLP entry needed).
Bare Stderr-Shipping
If you do not run an OTel collector and your aggregator only ingests JSON logs, set log.format: json on every component and let your platform's log collector (Fluent Bit, Vector, or journald) read stdout/stderr. You lose the metrics pipeline but keep the full traceID-correlated operational log stream.
What Next?
You have logs flowing, metrics scraped, and traceID queries answering "what happened to this task?". When those signals flag a failure, the per-scenario playbook for event broker, agent, persistence, and tool-execution failures is in Troubleshooting a Running Deployment.