The Solace OpenTelemetry Receiver is a software plugin that
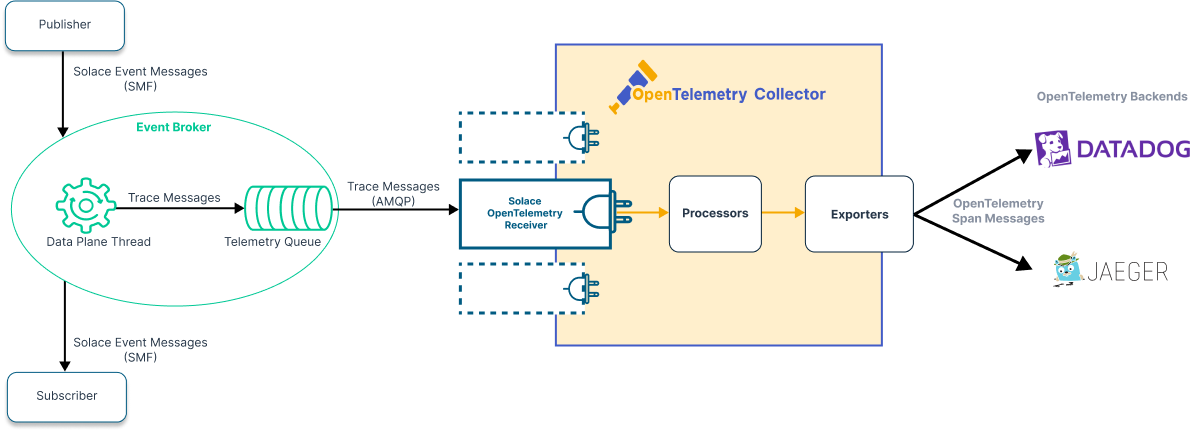
The Receiver consumes trace messages from a telemetry queue on the event broker and converts these messages into OpenTelemetry spans. The Collector then forwards these spans to your preferred OpenTelemetry backend (such as Jaeger, Prometheus, Zipkin, DataDog, DynaTrace, and so on).
You can use the Solace OpenTelemetry Receiver to collect basic statistics such as:
- the number of trace messages received
- connection status
- the number of failed connection attempts (particularly useful with HA standby event brokers)
- any other monitoring or debugging statistics
As part of the OpenTelemetry Collector, the Solace OpenTelemetry Receiver runs on any platform that the Collector is supported on. The Collector and Receiver do not run on the event broker; rather, they are deployed separately, as shown below:
For more information on the relationship between the OpenTelemetry Collector and custom receivers like the Solace OpenTelemetry Receiver, refer to the Collector section of the OpenTelemetry documentation.
Getting the Collector
The Solace OpenTelemetry Receiver is part of the opentelemetry-collector-contrib repository. For details about releases of the collector from this repository, see https://github.com/open-telemetry/opentelemetry-collector-contrib/releases. To get a container package of the collector, run the following Docker command:
docker pull ghcr.io/open-telemetry/opentelemetry-collector-releases/opentelemetry-collector-contrib:<version>
Where <version> is the version of the collector, for example 0.79.0.
Solace recommends that you use the latest OpenTelemetry Collector version.
For information about the minimum and recommended versions of the Collector, see Distributed Tracing Version Compatibility.
Configuring the Collector
The OpenTelemetry Collector and its components (Receivers, Processors, and Exporters) are configured using a YAML configuration file, which is loaded at start-up.
You must configure the following parameters in the Receiver:
- the event broker URL (to connect to the event broker): This URL must include the AMQP port for the Message VPN
- an authentication mechanism (basic, TLS client certificate, or OAuth)
- authentication credentials
- telemetry queue name
Once you have configured the configuration keys of the Collector components, you must enable them via pipelines within the OpenTelemetry service section (see OpenTelemetry Service for more information).
For more information on how to instantiate, configure, and manage the Receiver, see the Solace OpenTelemetry Receiver Project on GitHub.
High Availability (HA) and Disaster Recovery (DR)
For event brokers deployed in High Availability (HA) or Disaster Recovery (DR) event broker pairs, you can instantiate and configure two (or more) receivers on a single pipeline within the OpenTelemetry Collector. One receiver connects to the primary event broker, and the other connects to the backup event broker. Only the receiver that is connected to the active event broker is able to successfully receive trace messages. In a failover scenario, the receiver that cannot connect retries connecting frequently (and infinitely) to minimize the amount of time the receiver is disconnected.
This example shows how you can configure multiple instances of the receiver (with SASL plain authentication) in an HA or DR setup:
receivers:
  solace/primary:
    broker: [myHost-primary:5671]
    auth:
      sasl_plain:
        username: otel
        password: otel01$
    queue: queue://#telemetry-profile123

  solace/backup:
    broker: [myHost-backup:5671]
    auth:
      sasl_plain:
        username: otel
        password: otel01$
    queue: queue://#telemetry-profile123

  service:
    pipelines:
      traces/solace:
        receivers: [solace/primary,solace/backup]
Health Monitoring
You can configure the OpenTelemetry Collector to expose an OpenMetrics endpoint on port 8888 at the path /metrics as follows:
service:
 pipelines:
  metrics:
   address: ":8888"
The OpenTelemetry Collector also has a special receiver observability API for emitting observability signals (obsreport.Receiver). Below is a table with some of the Solace OpenTelemetry Receiver observability metric keys:
| Key | Type | Displayed Receiver Metric |
|---|---|---|
solacereceiver/failed_reconnections |
sum |
The number of failed event broker reconnections. |
solacereceiver/recoverable_unmarshalling_errors |
sum |
The number of recoverable errors by messages unmarshalling (such as missing required event attributes, bad fields, and so on). |
solacereceiver/fatal_unmarshalling_errors |
sum |
The number of fatal errors by messages unmarshalling (such as missing expected span attributes). |
solacereceiver/dropped_span_messages |
sum |
The number of dropped span messages. |
solacereceiver/received_span_messages |
sum |
The number of received span messages. |
solacereceiver/need_upgrade |
latest value |
Upgrade status of the receiver. If the value equals 1, this indicates that the receiver requires an upgrade and is not compatible with the messages received form an event broker. |
solacereceiver/reported_spans |
sum |
The number of received spans reported to the next component in the trace pipeline. |
solacereceiver/receiver_connection_status |
latest value |
Connection status of the receiver as follows:
|
If multiple Receiver instances are used with different given names (for example, in an HA setup), the full key names will be similar to otelcol_receiver_solace_solacereceiver_primary_receiver_status (for a Receiver instance called "primary").
Debugging
Logs are the primary mechanism available in the OpenTelemetry Collector for debugging Collector and receiver issues. Logs display:
- event broker connectivity issues
- issues in forwarding spans to the OpenTelemetry Collector or the backend
- issues in parsing trace messages that are received from the event broker
- any spans or trace messages that the receiver discards for any reason
To learn more about debugging levels on the receiver and how to change between them, refer to OpenTelemetry Service.
Receiver Performance
The Solace OpenTelemetry Receiver is designed as a high-performance real-time module that is capable of processing a high span rate. This is especially useful when the event broker publishes to a large number of endpoints. Conditions such as performance, server resources, and manageability of the configuration file may result in the need for multiple receivers to service all Message VPNs on the event broker. There is no fixed limit to how many receivers can be instantiated within one OpenTelemetry Collector. To allow for horizontal scaling of receivers and Collectors (given the very nature of distributed tracing across multiple microservices and brokers), telemetry queues are non-exclusive.
Flow Control
The OpenTelemetry Collector may encounter a situation where it cannot keep up with the rate of incoming trace messages. Without a proper strategy to manage the trace message flow (such as the use of a memory limiter processor), the OpenTelemetry Collector may crash due to an out-of-memory situation. To prevent this scenario, the Solace OpenTelemetry Receiver has a flow control strategy that provides a back pressure mechanism for synchronous and asynchronous pipelines:
-
Synchronous pipelines don't apply any trace message batching or buffering. This results in a decreased chance of message loss, free error propagation (as problems can be reported synchronously), and lower performance. This is the preferred option for cases where data integrity is valued more than trace message throughput.
-
Asynchronous pipelines apply trace message batching and buffering. This results in an increased chance of message loss, limited error propagation (as problems can't be reported synchronously), and higher performance. This is the preferred option for cases where trace message throughput is valued more than data integrity.
In asynchronous pipelines, the possibility of trace message loss increases with growing message throughput, with backend unavailability, if the Collector crashes due to an out-of-memory situation, or if the Collector process is killed by the operating system without graceful termination.
Configuring Flow Control for Components
Solace recommends the following configurations for the OpenTelemetry Collector components (Jaeger exporter, batch processor, and memory limiter processor) for synchronous and asynchronous pipelines.
Jaeger exporter is shown as an example. Other exporters may require a similar configuration.
| Component | Synchronous Pipelines | Asynchronous Pipelines |
|---|---|---|
|
Jaeger Exporter |
|
Keep as enabled (see OpenTelemetry Exporter Helper for Jaeger exporter configuration of asynchronous and queueing behavior). |
|
Batch Processor |
Don't enable (as the batch processor masks all errors returned from a next component). |
Enable as the last processor in the pipeline for enhanced performance (as this alignment places trace messages into batches before they are forwarded to the exporter). |
|
Memory Limiter |
Enable optionally (as only one trace message flows along at a given moment). Configure |
Configure low enough to apply back pressure to the Solace OpenTelemetry Receiver (for example, set
|
The implemented flow control strategy should be aware of the Solace OpenTelemetry Receiver lifecycle. For instance, termination of the Receiver instance must interrupt the retry timer (if it's running using passed in context.Context). If not, the receiver may not acknowledge the trace messages after termination, and these trace messages will be delivered to another Receiver instance as it becomes available.
For more information on the Jaeger exporter, see Jaeger documentation. For more information on the batch processor, see OpenTelemetry Batch Processor. For more information on the memory limiter, see OpenTelemetry Memory Limiter.
Configuring Flow Control on the Receiver
By default, the Solace OpenTelemetry Receiver has a delayed retry feature with a single timeout value of 10 milliseconds. Delayed retries occur each time a non-terminal error is returned from a pipeline due to memory shortage or backend unavailability. Solace recommends implementing a delay using a configuration that is similar to check_interval of the memory limiter. This enables usage of valid time units ("ns", "us", "ms", "s", "m", "h"). Only values less than 1 are currently supported.
This example shows you how to configure the Solace OpenTelemetry Receiver for a 1 second delay:
receivers:
  solace/primary:
    broker: [myHost-primary:5671]
    flow_control:
       delayed_retry:
         delay:1s
....
Observability for Flow Control
The Solace OpenTelemetry Receiver emits the following stats about trace message flow control. These stats can be monitored to tune receiver performance under heavy load.
| Key | Type | Displayed Receiver Metric |
|---|---|---|
solacereceiver/receiver_flow_control_status |
latest value |
The current state of flow control:
|
solacereceiver/receiver_flow_control_recent_retries |
latest value |
The most recent (or current) number of retries while the receiver is flow-controlled. |
solacereceiver/receiver_flow_control_total |
sum |
The total number of times the receiver was flow-controlled. |
solacereceiver/receiver_flow_control_with_single_successful_retry |
sum |
The number of flow control situations resolved after the first retry. |
Here are some tips to tune your receiver performance:
-
If
receiver_flow_control_recent_retriesalways reports 1, the configured delay may be too high. To achieve higher performance, decrease the configured delay to increase the number of retries required in a flow control situation. -
If
receiver_flow_control_recent_retriesalways reports a high number, the configured delay is too low. To achieve higher performance, increase the configured delay to reduce the number of retries required in a flow control situation. -
Use the smallest possible retry interval so that
receiver_flow_control_totalis equal toreceiver_flow_control_with_single_successful_retry. In this case, the receiver doesn't need to retry more than once to push the trace data through the pipeline.
Security
As part of the OpenTelemetry Collector, the Solace OpenTelemetry Receiver uses configuration utilities and coding practices established by the OpenTelemetry community. By default, the Receiver enforces TLS by connecting to the event broker and applying common authentication mechanisms like OAuth, client certificate authentication, and basic username/password authentication. The Receiver validates the event broker's server certificate, including the hostname and expiry, via the trust store that is provided in the receiver's configuration.
For more information about the security of the Collector, refer to OpenTelemetry Collector Security Best Practices.
Support for the OpenTelemetry Collector
Customers who use self-managed event brokers (not event broker services in Solace Cloud) are responsible for deploying, upgrading, and maintaining the security posture of their OpenTelemetry Collector deployments.
Solace provides support for the OpenTelemetry Collector when connected to event brokers with distributed tracing licenses for issues impacting distributed tracing in accordance with our current support terms and will treat issues with the OpenTelemetry Collector with equal severity and priority as any other similar business-impacting issues. Bugs and/or fixes requiring changes to the OpenTelemetry Collector or the accompanying Solace OpenTelemetry Receiver will be submitted to OpenTelemetry and will be provided only in a future release of the OpenTelemetry Collector.
Solace may provide commercially reasonable efforts at our discretion toward further development activities that deliver bug resolution, enhancements, and feature requests from customers should they suit the strategic direction of event brokers and the overall suite of telemetry capabilities.