Using the Account Overview Dashboard
The Solace Insights Account Overview dashboard provides an overview of Insights for the account that you are logged into. Specifically, the Account Overview dashboard gives you:
- a starting place to quickly see the high-level aspects and breadth of your estate
- a quick understanding of the aspects in your account that may require attention (including indication if you have a potential opportunity for some optimizations)
- an understanding of the volume of traffic going through your event-driven architecture (EDA) and the depth of metrics and monitors captured
- an access point to navigate to your Datadog account and access the set of Solace Insights dashboards for Datadog available in Insights (this requires that your account has Insights Advanced Editor or Insights Advanced Manager role assigned, see Enabling Solace Insights Advanced Monitoring for more information).
This page is accessible from Insights from the navigation bar and gives you an overview at the account level of your estate. An estate refers to your deployment of event broker services, the messaging and activities that occur, and any capabilities that are part of your account for Solace Cloud (Workspace).
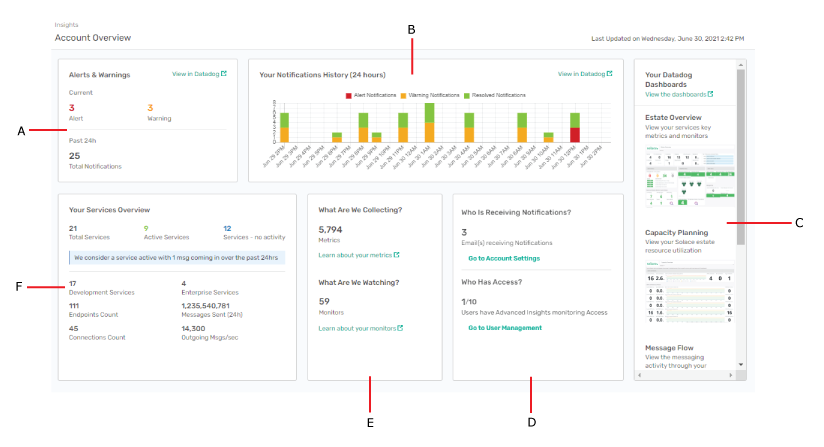
- Alerts & Warnings—A count of the monitors that have alerts and warnings raised. A link to Datadog takes you to the list of warnings and alerts that are current in the estate. It's important to understand that Current is of the count at the current time and doesn't indicate the total number of alerts and warnings that may have occurred in the last 24 hours. For example, if an Alert occurred and was cleared, it would not be represented in the count. There is also the count of the notifications that you have received in the last 24 hours.
- Your Notifications History—A time-series representation of the alerts, warnings, and notifications that you have received in the last 24 hours.
- Your Datadog Dashboards —A link to launch any of the listed Solace Insights dashboards in a separate browser - provided your user account has the Insights Advanced Editor or Insights Advanced Manager role . For more information, see Enabling Solace Insights Advanced Monitoring.
- Who Is Receiving Notifications?—The number of accounts in Solace Cloud that have the Insights Advanced Editor or Insights Advanced Manager role assigned.
- What Are We Collecting—A count of the metrics and monitors currently active in the estate.
- Your Services Overview—The current count of various important aspects of that includes a breakdown of event broker services [total, active, inactive, standalone (developer), and High-Availability (enterprise)], endpoints, and connections. The count for messages is the total for the past 24 hours.