Context Propagation for Distributed Tracing
As discussed in the overview, distributed tracing tracks an event all the way from the publishing application, between event brokers, and to the receiving application. A distributed trace, or simply a trace, is a record of the path taken by an event message as it propagates through an event mesh. A trace is made up of the spans that are emitted at each point along the journey. An OpenTelemetry backend, such as Jaeger or DataDog, assembles these spans into a trace and provides a visual view of the entire lifespan of an event message.
Trace context is the metadata that allows new spans to be created as children of another span in the same trace, or to link to other spans in the trace, regardless of where the other spans are generated. Context propagation is the mechanism by which that metadata is carried by event messages across service and process boundaries.
Personally Identifiable Information (PII) Exposure—Distributed tracing captures metadata about message flow, including topic names, queue names, and message properties. This trace information is propagated through your event mesh and sent to observability backends. To minimize PII exposure, avoid including sensitive personal information in topic strings, queue names, user properties, or other message metadata that becomes part of the trace context.
Let's take a look at an example to see how context propagation works. The diagram below shows a simple architecture that includes one event broker and two clients (one that publishes messages, and one that consumes messages). Each process that handles the event message emits a span. These spans are consumed by a receiver, and then assembled together by an OpenTelemetry backend system to form a trace.
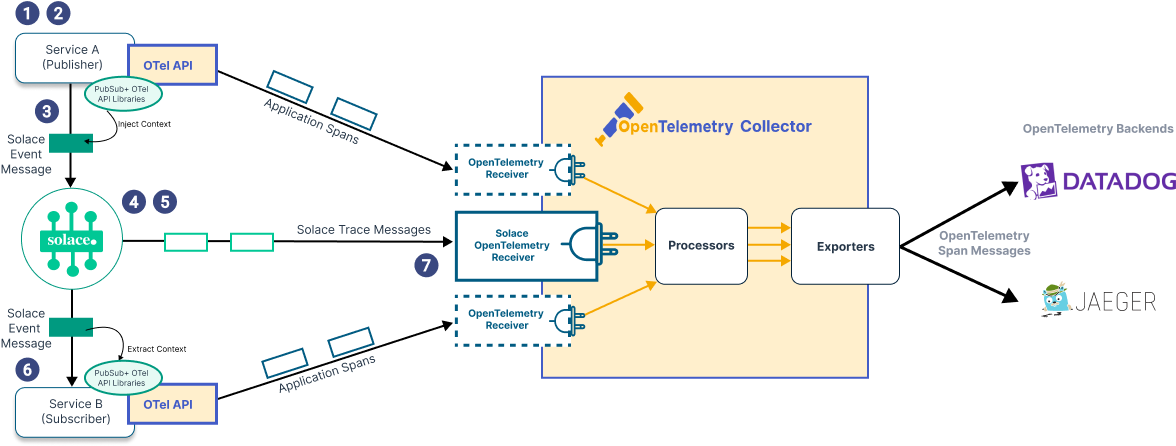
Let's examine each step in this simplified example:
- Service A uses telemetry instrumentation to generate context information that can be added to messages.
- Service A prepares an event message using a Solace Messaging API, and injects trace context into that message using a OpenTelemetry Integration API Library. Service A might also separately generate OpenTelemetry spans with that same context using an OpenTelemetry API.
- The Solace Messaging API sends the message to the event broker.
- The event broker receives the message. If the broker has trace filter subscriptions that match the message's topic, it generates one or more spans. The spans are added to one or more trace messages, and the event broker sends the trace message to the telemetry queue.
- If the trace message is successfully enqueued, the event broker updates the event message's trace context with the context of the span. This starts a send span, which is the trace context sent with the message to the next hop (which could be another event broker or a consuming application). In this example, the next hop is the consuming application, Service B.
- Service B consumes the event message via Solace Messaging API, and extracts the trace context using a OpenTelemetry Integration API Library. It then uses this trace context to establish the parent span for the first span that is created upon receive.
- For send spans, the event broker records the time it sent the message to Service B as the start time for the send span. When the message is consumed by Service B, an acknowledgment is sent to the event broker. The event broker receives the acknowledgment, ends the send span, and records the outcome of the delivery attempt to Service B.
- At any time, the Solace OpenTelemetry Receiver can connect to the event broker to receive the Solace trace messages and convert them to standard OpenTelemetry spans. Other receiver modules receive the telemetry spans created by the producer and consumer applications. The OpenTelemetry Collector processes all the spans, which can then be correlated by a backend monitoring tool.
At each hop in an event mesh, the event message is updated with the latest context information. This extends the overall trace as the event message moves through the mesh.
Delivery of a send span is not guaranteed.
Context Propagation in the Event Broker
Two types of context can be propagated in event messages:
- Span context—Solace Messaging API and event brokers can interpret and modify trace context within a message as the message is transported.
- Baggage (also known as correlation context)—Baggage is a set of key-value pairs that can be injected into and read from the context. Solace Messaging APIs and event brokers never modify baggage; they only read it and include it in trace messages.
Trace context and baggage are carried in the event message. If an event message is successfully traced (that is, it generates and enqueues a span), the event broker updates the event message's trace context with the context from the span. If, at any point after receiving an event message but before generating a span, the event broker encounters a condition where it cannot trace the event message (for example, the telemetry queue is full), the broker passes the trace context unchanged in the event message to the next hop in the event mesh.
To handle event messages and generate spans appropriately, the event broker does the following when it receives an event message:
- Performs basic checks (such as verifying that the message's receive flow is valid, the message is the next expected message on that flow, the message complies with any topic access controls). If any of these tests fail, the message is discarded without tracing.
- Determines whether the event message is to be traced. If the message is to be traced, it sets the
sampledflag in the message's trace context. Otherwise, it leaves thesampledflag unchanged. - Processes the event message.
- Uses the event message's trace context to create a child span.
- Updates the event message's trace context at the same time the event message and trace message are persisted. The event message's trace context isn't updated sooner so that, if the event broker encounters a condition where it cannot trace the event message (for example, the telemetry queue is full), it doesn't generate a trace message—it passes the received trace context unchanged in the event message to the next hop in the event mesh.
The event broker supports distributed tracing context propagation over HTTP and AMQP. Applications that use HTTP or AMQP to publish or consume messages from an event broker can propagate context information according to W3C standards. For more information, see:
Context Propagation with Solace Messaging APIs
Context propagation with Solace Messaging APIs is supported by the OpenTelemetry Integration API Libraries. These libraries allow you to inject context into or extract context from Solace event messages.
You deploy the OpenTelemetry Integration API Libraries alongside the Solace Messaging API for the programming language you are using to develop your application. These libraries have dependencies on the OpenTelemetry API (which must also be deployed with your application).
The OpenTelemetry Integration API Libraries support W3C propagators only.
See the following links for information about specific libraries, including where you can get them:
- For OpenTelemetry Integration API for the Solace Messaging API for Java, see Context Propagation for Distributed Tracing in the Solace Java API.
- For OpenTelemetry Integration API for the Solace Messaging API for JMS, see Instrumenting JMS and Jakarta for Distributed Tracing.
- For OpenTelemetry Integration API for the Solace Messaging API for JCSMP, see Instrumenting JCSMP for Distributed Tracing.
- For OpenTelemetry Integration API for the Solace Messaging API for .NET, see Instrumenting .NET for Distributed Tracing.
- For OpenTelemetry Integration API for the Solace Messaging API for JavaScript and Solace Messaging API for Node.js, see Instrumenting Node.js for Distributed Tracing.
- For OpenTelemetry Integration API for the Solace Messaging API for Go, see Instrumenting Go for Distributed Tracing.
- For OpenTelemetry Integration API for the Solace Messaging API for Python, see Instrumenting Python for Distributed Tracing.
Visualizing Trace Information in the Backend
Tracing helps you understand the path an event message takes as it travels through distributed systems. A trace is made of one or more spans, with the first span representing the root span. Every root span represents a request from start to finish. As a request moves through a distributed system, it usually generates multiple spans. If a new span is generated by a request it is considered a child span, and the span that generated it is its parent. Child spans provide additional context of the steps that occur during a request.
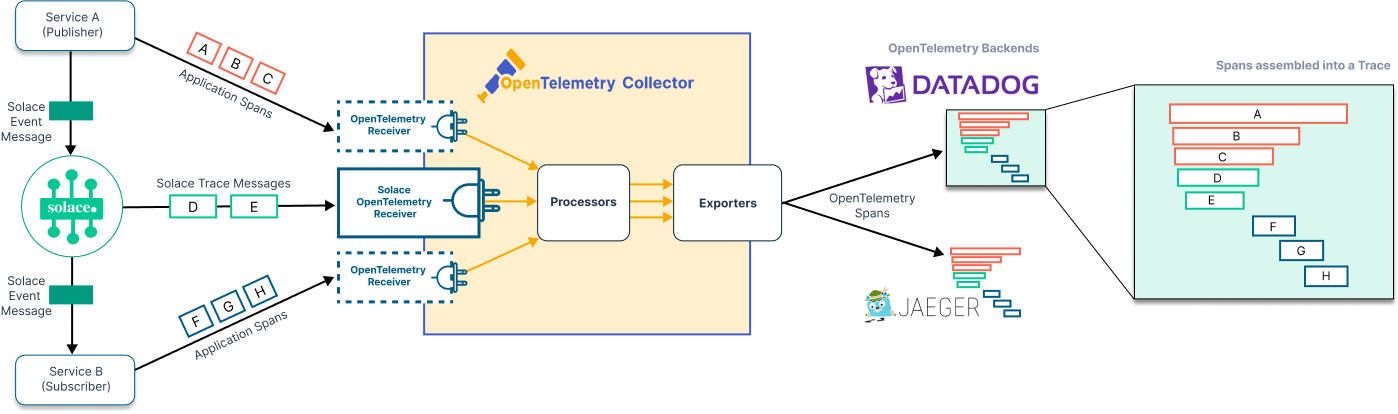
OpenTelemetry receivers collect different types of spans, including spans from the OpenTelemetry APIs and the event broker. The OpenTelemetry Collector collects, processes and exports these spans to a backend, where they are assembled into waterfall visualizations of end-to-end traces. These visualizations show the relationship between a root span and its child spans, and can help you improve and debug your distributed applications. The diagram below shows how spans generated at different points in a distributed system are assembled into an end-to-end trace in an OpenTelemetry backend:
For a detailed explanation of how spans are collected into a trace, see OpenTelemetry Traces.