Distributed Tracing
When an organization has applications that consists of tens, hundreds, or thousands of services running across many hosts, and sharing messages over one or more event meshes, it's no longer possible to diagnose problems simply by troubleshooting an error message or looking at a log. In this kind of system, you need a solution that can track an event all the way from the sending application, between event brokers, and to the receiving application. Distributed tracing provides this ability, allowing an administrator to trace the lifecycle of an event as it travels through the event mesh.
When distributed tracing is enabled, the event broker generates special guaranteed messages when certain operations happen. The publisher and subscriber APIs also generate spans when messages are sent and received. OpenTelemetry receivers
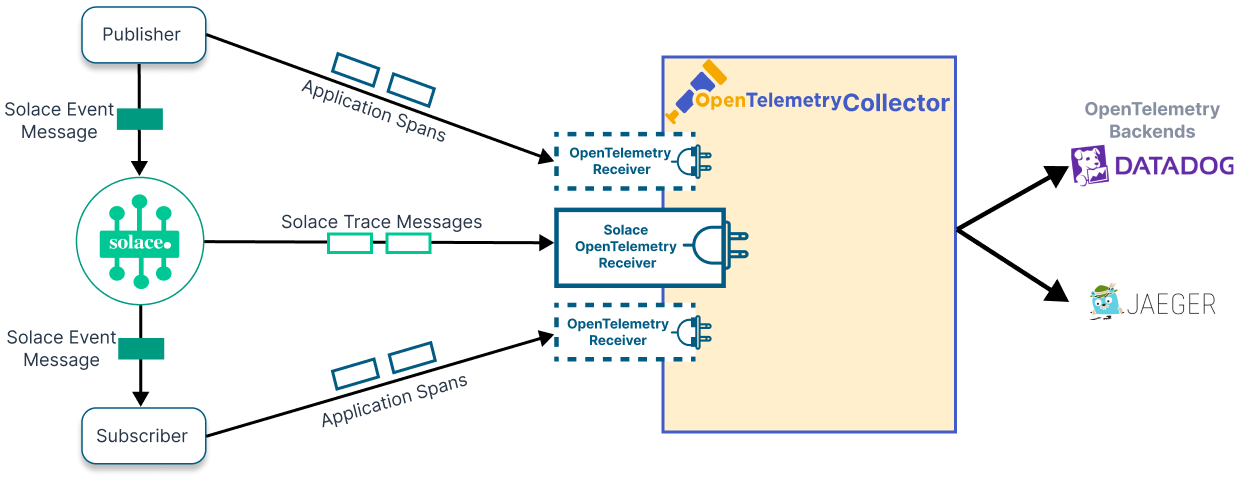
The distributed tracing functionality of Solace
Which Event Broker Actions are Traced?
Spans are generated at the following points:
- event message sent by the event broker to the consumer (Send Span)
- event message acknowledged by the consumer (Send Span)
- event message received by the event broker (Receive Span)
- event message enqueued by the event broker (Receive Span)
- event message deleted by the event broker or an administrator (Delete span)
- For example, if a message exceeds its time-to-live (TTL), maximum number of redelivery attempts, or maximum number of hops.
- If you use any management interface, for example the Solace Event Broker CLI, Broker Manager, or SEMP, to delete multiple messages at once, this does not generate Delete spans.
- event message moved to a configured dead message queue (Move span).
- For example, if a message exceeds its time-to-live (TTL) or maximum number of redelivery attempts.
Tracing in the Event Broker
The event broker generates spans at certain points in the lifecycle of an event message. A span represents a single operation on the event broker, such as receiving and sending an event message, moving a message to a dead message queue, or deleting a message.
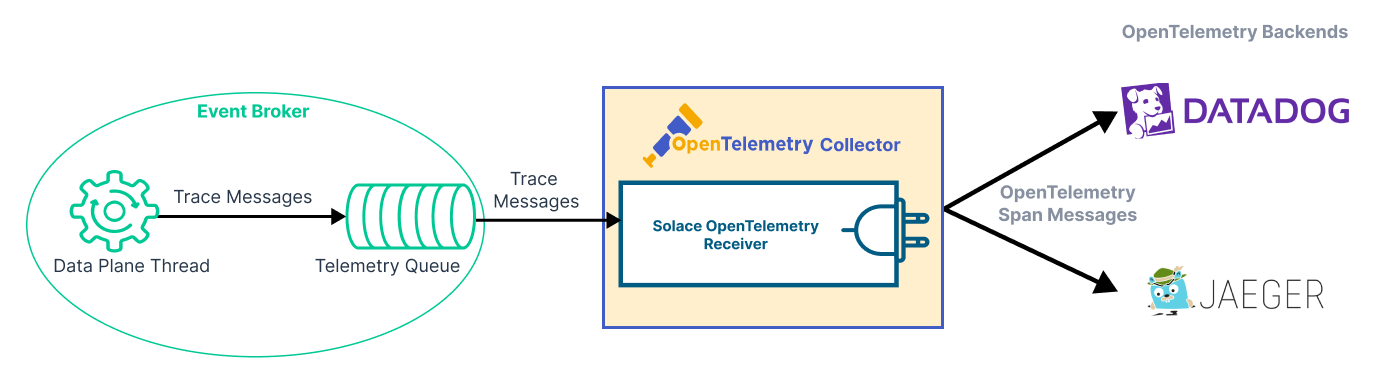
The event broker generates a span when it receives an incoming event message or sends an outgoing event message. The broker sends trace messages, which contain one or more spans, to the telemetry queue. A client binds to the queue and consumes the trace messages. This client
These components are illustrated in the following diagram:
For information about how spans are correlated to produce traces, see Context Propagation for Distributed Tracing.
For details about how to set up the event broker for distributed tracing, see Configuring Distributed Tracing.
For details about how to set up event broker services for distributed tracing, see Enabling Distributed Tracing.
Tracing with Solace Messaging APIs
To manipulate trace context in Solace Messaging APIs, you use the OpenTelemetry Integration APIs. These libraries provide special getter and setter methods that allow your applications to inject trace context into or extract trace context from SMF messages. The OpenTelemetry Integration API Libraries also include the OpenTelemetry API, which allows your publisher and subscriber applications to create spans that backend applications use to generate traces.
For more information, see Context Propagation with Solace Messaging APIs
Receivers
A receiver is a client that binds to the telemetry queue and consumes trace messages. The Solace OpenTelemetry Receiver, which is a plugin for the OpenTelemetry Collector project, makes it easy for a client to consume trace messages and convert them to a standard format. The Solace OpenTelemetry Receiver consumes trace messages as Guaranteed Messages from the event broker and produces generic trace spans for the OpenTelemetry Collector.
For more information, see Solace OpenTelemetry Receiver.
Event Broker Performance
Because distributed tracing causes the event broker to generate additional guaranteed trace messages, there can be an impact on the event broker's performance (throughput of event messages). As more messages pass through the broker, this performance impact becomes more evident. You should take this into account when deciding which messages to trace.
The ratio of event brokers (or HA groups) to receivers is flexible—multiple event brokers can feed a single receiver, and multiple receivers can consume trace messages from a single broker. However, we recommend that you deploy one receiver per event broker (or HA group) until the performance of your overall architecture is understood.
Feature Interactions
- Disaster Recovery (Replication)
-
Standby nodes do not generate trace spans. However, receivers can bind to the telemetry queue on a standby node to allow residual spans to be drained after a VPN switches from active to standby.
- Transactions
-
Messages published as part of a local transaction do not generate trace messages.
-
Messages that succeed in a commit will appear to be enqueued, even if a subsequent message in the local transaction causes the commit to fail. To determine why a committed message was not delivered, you must search all spans for the same transaction ID on the same session to find failed messages. If at least one message in the transaction failed, none of the messages in the transaction were ever eligible for delivery.
- Ingress Selectors
-
Messages are traced when received by the event broker and enqueued before the broker evaluates ingress selectors. If a message does not match an ingress selector, the event broker discards the message and generates a delete span.
- Message VPN Bridges
-
Messages received from bridges are traced the same as regular client messages.
- DMR Links
-
Messages arriving over DMR links are traced the same as regular client messages.
- DMQ Message Traces
-
Messages that are admin-copied or moved to a DMQ get a new Replication Group Message ID. When send spans are generated for these messages, the parent span will be the original message's receive, and there will be no span generated that records the message's new Replication Group Message ID.
- Partitioned Queues
-
Messages are traced through partitioned queues, and the partition within the partitioned queue traversed by the message is identified.
Product Key
A product key is required to use distributed tracing in production or for long-term use. Contact Solace to obtain a product key. To install a key on your event brokers, see Product Keys .
Demo Mode
You can try distributed tracing in demo mode (without a product key) for seven days by setting up a telemetry profile and enabling distributed tracing on that profile.
Demo mode is not for production or long term use.
Solace does not provide support for distributed tracing in demo mode. Support for distributed tracing requires that a product key is installed on the event broker.
For details about demo mode, including the terms of use, see Distributed Tracing Demo Mode.
Restarting Your Event Broker
If you need more time, you can restart your event broker to extend your demo.
To restart your event broker, enter the following commands in the Solace Event Broker CLI:
solace> enable
solace# reload
On the software event broker, the reload command stops the container. For container images, you may need to manually restart the container, depending on the restart policy of your container runtime.
Try Distributed Tracing
Click below to try a Codelab and see distributed tracing in action.