Enabling Distributed Tracing
When distributed tracing is enabled, the event broker service generates trace messages when certain operations happen. A purpose-built client then consumes these messages from the telemetry queue and converts them to the OpenTelemetry standard format that can be received, processed, and viewed in Solace Insights (requires an Solace Insights account), or various common tracing backends supporting OpenTelemetry protocols, such as Datadog, Jaeger, DynaTrace, New Relic, and Grafana, among others.
You can install a distributed tracing license, create a tracing profile, and a tracing client all from the Solace Cloud and Broker Manager. During this process, a pod is created that contains the Collector and Receiver. The Mission Control Agent creates the necessary telemetry queue, client username, and password for your event broker services.
To configure distributed tracing for your event broker service, follow these steps:
- Ensure your deployment meets the prerequisites for enabling distributed tracing.
- Create a tracing destination for the event broker service in the Cloud Console. See Creating a Tracing Destination.
- Create a telemetry profile for the event broker service in Broker Manager. See Creating a Telemetry Profile.
- Enable distributed tracing for your event broker service in the Cloud Console. See Enabling Distributed Tracing for an Event Broker Service.
This process can also be performed using the Solace Event Broker CLI. See Using the Solace Event Broker CLI to Enable Distributed Tracing for an Event Broker Service.
After deploying distributed tracing, if you have your own self-managed OpenTelemetry for collecting application trace spans, you can send the application trace spans to your Insights Datadog account. Sending application trace spans to Insights provides a complete distributed trace for a message, from publisher, to event broker service, to consumer, all in your Insights Datadog account. For more information, see Sending Application Trace Spans to Insights Using a Self-Managed OpenTelemetry Collector.
Prerequisites for Enabling Distributed Tracing in Solace Cloud
To use distributed tracing with your event broker services, you must meet these minimum requirements:
-
You must have permissions based on the activity you want to perform:
-
Creating, editing, updating, and deleting Tracing Destinations: Administrator
-
Creating, editing, and deleting a Telemetry Profile: Mission Control Manager or Mission Control User with the Manager role for the specific event broker service.
-
Enabling, updating, and disabling distributed tracing for an event broker service: Mission Control Manager or Mission Control User with the Manager role for the specific event broker service.
-
-
Have available distributed tracing limits. See Viewing Your Distributed Tracing Licenses.
-
Have basic authentication enabled for the event broker service. See Configuring Authentication for Messaging Clients.
-
You must have the following port configurations enabled for the event broker service:
-
For the Enable Secured Broker Management Host (SEMP) port. If you:
-
configured the port number to something other than the default value (943)
-
created an event broker service in a Customer-Controlled Cluster and configured public endpoints
You must ensure the Enable Secured Broker Management Host (SEMP) port hostname (
mr-connection-<connection_endpoint_id>.messaging.solace.cloud) is reachable. For more information, see Connection Details for Operational Connectivity. -
-
An AMQP port must be enabled and set to 5671.
For more information, see Editing the Existing Port Configuration for an Event Broker Service.
-
-
For Customer-Controlled Clusters, you must be able to pull docker images from either the
gcr.io/gcp-maas-prod/solace-distributed-tracing-collectorrepository or the Azure China registry. If you require access to the Azure China registry, contact Solace. -
If you are using an
HTTPorHTTPSproxy in a Customer-Controlled Cluster, you must also meet additional prerequisites. See Prerequisites for Using a Proxy in a Customer-Controlled Cluster. -
If you want to use TLS encryption to create a secure connection to your observability backend, you must select either an OTLP/gRPC or OTLP/HTTP endpoint when creating your tracing destination.
-
TLS encryption requires certificates, which you can either upload, or for a Customer-Controlled Cluster, reference in a Kubernetes secret. Using a Kubernetes secret reference comes with additional impacts that you must consider. For more information, see Understanding OTLP Certificate Configuration for Tracing Destinations.
-
If you need to use different TLS certificates for different backends or environments, you must create separate tracing destinations for each certificate configuration. Each event broker service can use only one tracing destination at a time.
-
When adding certificates to your tracing destination, you must use the PEM format and ensure to include the
-----BEGIN CERTIFICATE-----and-----END CERTIFICATE-----sections of the certificate. -
Using a TLS-intercepting proxy in your Customer-Controlled Cluster can affect certificate verification behavior for your OTLP tracing destinations. For more information, see Proxy Interaction with OTLP Tracing Destination TLS Certificate Verification.
-
Infrastructure Impacts on the Performance of Distributed Tracing
The performance of distributed tracing in Solace Cloud is affected by your choice of Kubernetes provider, and OpenTelemetry backend. Performance is tied to the ability of the receiver to consume and the collector to process guaranteed messages.
On average, you can expect a performance of at least 1000 trace spans per second. Different factors, such as your Kubernetes environment and settings, can affect these results.
Resource Requirements for Customer-Controlled Cluster Deployments
Customer-Controlled Cluster deployments must make sure your Kubernetes cluster meets the additional resource requirements for deploying Distributed Tracing. For more information, see Resource Requirements for Additional Solace Service Deployments.
Viewing Your Distributed Tracing Licenses
You must have a license for the event broker service on which you intend to enable distributed tracing.
Each distributed tracing licensing tier supports specific event broker service classes. You can use the following table to understand the service classes supported by each distributed tracing license tier.
| Distributed Tracing License Tiers | Service Classes Supported |
|---|---|
| Solace Distributed Tracing 250 Tier | Enterprise-100 Standalone and Enterprise 250 |
| Solace Distributed Tracing 1K Tier | Enterprise 1K |
| Solace Distributed Tracing 10K Tier | Enterprise 5K and Enterprise 10K |
| Solace Distributed Tracing 200K Tier | Enterprise 50K and Enterprise 100K |
See Service Class Options for Event Broker Services for more information about service classes. To get licenses for distributed tracing, contact Solace.
To view your distributed tracing licenses, follow these steps:
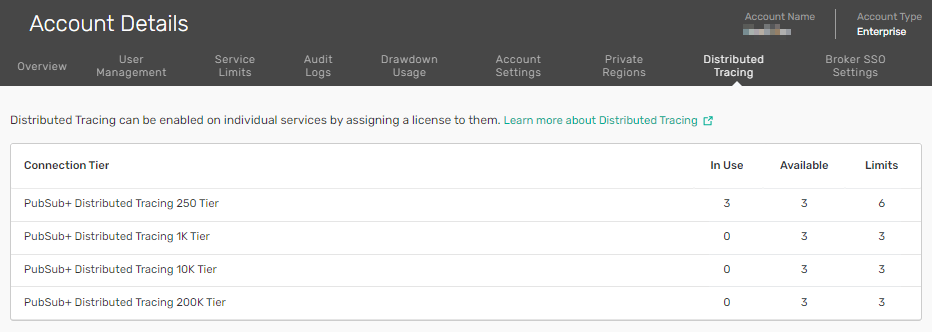
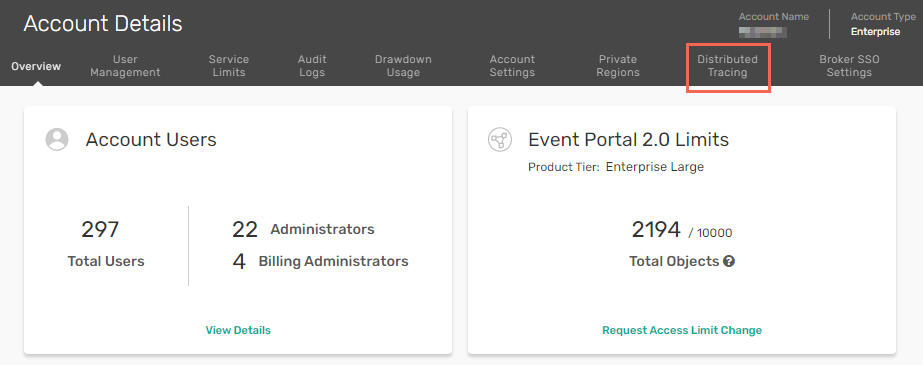
- From the Cloud Console, click User & Account, select Account Details, and then click the Distributed Tracing tab.
- Connection Tier—The distributed tracing license tier.
- In Use—The number of licenses currently being used by your event broker services.
- Available—The number of licenses currently available to your event broker services.
- Limits—The number of event broker services that you have a distributed tracing license for. This number is the sum of the number of licenses shown in the In Use and Available columns.
The table located at the top contains the following information about your distributed tracing limits:
Creating a Tracing Destination
The first step in deploying distributed tracing for your event broker service is to create a tracing destination. The tracing destination configures your collector to send messages it receives from the receiver to your chosen tracing destination. You can create up to 10 tracing destinations. However, you can assign each event broker service a single tracing destination. This allows your event broker services to send data to different observability backends. When creating a tracing destination, you have several destination options, including:
- Solace Insights (requires a Solace Insights account)
- DataDog
- OTLP/gRPC endpoint
- OTLP/HTTP endpoint
The Solace Insights option requires a separate Solace Insights account and offers viewing of trace data in Insights without requiring additional configuration.
The other options on the list provide the ability to send trace data to the observability backends of your choice with some additional configuration. The OTLP options support sending your trace data using either gRPC or HTTP format, providing compatibility with a wide variety of observability backends, including Jaeger, DynaTrace, New Relic, and Grafana, among others. Observability backends may support one or both formats. When selecting an OTLP-based option, you must select the format type and configure it so that it matches the format (HTTPS or gRPC) supported by your chosen observability backend. See the documentation for your observability tool for information about the formats they support.
If you are deploying distributed tracing in a Customer-Controlled Cluster with a proxy, you must ensure your proxy does not block the tracing headers, and if you want to use an NO_PROXY exclusion list, you must contact Solace and provide the list of exclusions. No other configuration is required, as the distributed tracing collector gets your proxy configuration from the Mission Control Agent during initialization. For more information, see Using Distributed Tracing with a Proxy in a Customer-Controlled Cluster.
To create a tracing destination, perform these steps:
-
Log in to the Solace Cloud Console if you have not done so yet. The URL to access the Cloud Console differs based on your
-
Click User & Account, select Account Details, and then click the Distributed Tracing tab.
- Click Create Tracing Destination to open the Create Tracing Destination dialog and use the fields on the information related to your tracing destination. Note that the fields change depending on the destination type you select.
- Name—Enter a name for the tracing destination.
- Type—Select the service type and use the following table to guide your configuration options.
- Region—Select your Datadog region from the drop-down menu.
Your Datadog region is related to the URL you use to access your Datadog account. If you do not know your Datadog region, see the table in the Datadog documentation to determine the region from the URL used to access your account.
- API Key—Enter your Datadog API key into the field.
Endpoint—Enter the
host:portinformation for where the exporter sends the trace information using the protocol (HTTP or gRPC). See the documentation for your chosen observability backend for endpoint information and protocol support.Header—Enter the credentials required by your observability backend to send them your tracing data.
Connection Security—Select the type of connection security you want your tracing destination to use. Solace supports three types of security connection: plaintext, TLS, and mTLS. The choice you make in this field changes the fields the form uses for collecting the configuration information you must provide. For more information, see Configuring Connection Security for an OTLP Tracing Destination.
Destination Type Fields to configure Solace Insights No additional configuration is required (requires a Solace Insights account).
Datadog OTLP/gRPC endpoint OTLP/HTTP endpoint -
Click Save.
- Click Create.
The Distributed Tracing tab displays your tracing destination.
-
Optional: You can add additional tracing destinations by clicking Create Tracing Destination and repeating this procedure. You can create a maximum of 10 tracing destinations.
Editing a Tracing Destination
You can edit your tracing destination if required. Note that updating your tracing destination does not update the distributed tracing service on the event broker services using that tracing destination automatically. You must update the event broker service from the Services Requiring Updates window. See Updating the Tracing Destination.
- From the Cloud Console, click User & Account, select Account Details, and then click the Distributed Tracing tab.
- Click more actions
 associated with the tracing destination you want to edit and select Edit to open the Edit Tracing Destination dialog.
 - Change the fields on the window as needed and click Update.
You must now update your event broker services to use the updated tracing destination. See Updating the Tracing Destination.
Updating the Tracing Destination
You can review and update the tracing destination for your event broker services as needed.
- From the Cloud Console, click User & Account, select Account Details, and then click the Distributed Tracing tab.
- Click View Services to open the Services Requiring Updates dialog.
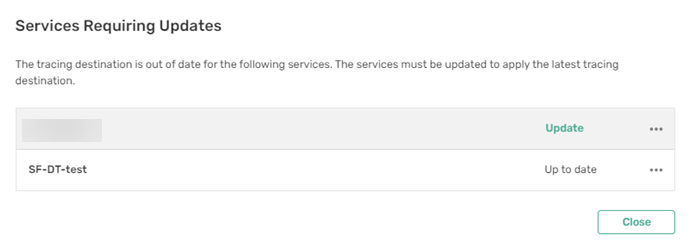
- Click Update on any event broker service that shows Update to upgrade the tracing destination for that event broker service. From this dialog you can also click more actions on any service and then click Service Details to open the Status tab of your service where you can view detailed service information, including whether you have deployed a license for distributed tracing to the service.
The notification banner under the Tracing Destination title indicates the number of event broker services that require updating, if any.
Deleting a Tracing Destination
You can delete a tracing destination you have created. You should note that deleting a tracing destination will cause any enabled distributed tracing configurations on event broker services to fail.
- From the Cloud Console, click User & Account, select Account Details, and then click the Distributed Tracing tab.
- Click the more actions associated with the tracing destination you want to delete and select Delete.
Understanding OTLP Certificate Configuration for Tracing Destinations
If you need to use different TLS certificates for different backends or environments, you must create separate tracing destinations for each certificate configuration. Each event broker service can use only one tracing destination at a time.
When configuring OTLP/gRPC or OTLP/HTTP tracing destinations with TLS encryption, you must provide certificates for mutual TLS (mTLS) authentication, and can optionally provide CA certificates for server verification depending on your security requirements. Certificates are configured at the organization level and associated with a specific tracing destination.
There are two methods for providing certificate material to your tracing destination:
- Uploading Certificates—You upload the certificate content in PEM format directly through the Cloud Console. Solace Cloud automatically creates a Kubernetes secret and mounts it into the distributed tracing collector pod. Solace recommends this approach for most deployments because it provides centralized management and requires no additional cluster configuration.
- Kubernetes Secret Reference—Available to Customer-Controlled Clusters only. You provide the name of a Kubernetes secret that you have already created in your Customer-Controlled Cluster. The collector pod references this secret directly. For considerations when using secret references, see Using Kubernetes Secret Reference for Certificate Authentication in Customer-Controlled Clusters.
Using Kubernetes Secret Reference for Certificate Authentication in Customer-Controlled Clusters
Kubernetes secrets are scoped to individual Private Regions (datacenters). If your organization manages multiple Customer-Controlled Clusters, a secret reference that works in one Private Region may not exist or may have a different name in another Private Region.
If you want to use a Kubernetes secret reference across multiple datacenters, you must do one of the following:
- Standardize your secret names across all datacenters so the same secret reference works everywhere.
- Create separate tracing destinations (and potentially separate telemetry profiles) for each datacenter that uses a different secret name.
Configuring Connection Security for an OTLP Tracing Destination
When configuring a tracing destination with an OTLP/gRPC or OTLP/HTTP endpoint, you must select a connection security option for the endpoint. Solace supports the following connection security options:
Each connection security type has different certificate requirements, which are listed in the following table:
| Connection Security | CA Root Certificate | Client Certificate | Client Private Key |
|---|---|---|---|
| Plaintext | Not required | Not Required | Not Required |
| TLS Insecure | Not required | Not Required | Not Required |
| TLS Secure | Required Can use System Default, Upload, or Kubernetes Secret Reference. | Not Required | Not Required |
| mTLS Insecure | Not required | Required | Required |
| mTLS Secure | Optional Only required for private or custom CAs. | Required | Required |
The connection security option you select determines which configuration fields appear in the Create Tracing Destination dialog. Use the following tables, based on your initial choice of connection security, as a guide to complete the fields:
- Plain Text
- You send your distributed tracing data to your observability backend unencrypted as plain text. No further configuration is required.
- TLS
- Selecting TLS shows a Server Verification field, where you must select one of the following options:
Server Verification Fields to configure Insecure Your distributed tracing data is encrypted, but the OTEL Collector skips certificate verification. No further configuration is required. Secure You send your distributed tracing data encrypted, and the observability backend's host-name and server certificate are verified. When you select Secure a new TLS Configuration field appears. You must select one of the following options in the field: System Default Your tracing destination uses the operating system's default certificate authority trust store. This option works when your observability backend uses a certificate from a publicly trusted CA. No further configuration is required. Upload Certificates Opens a CA Root Certificate (PEM) field where you must enter the CA Root Certificate in PEM format. The certificate is provided by your observability backend.
Kubernetes Secret Reference Opens a CA Root Secret Name field where you must enter the name of a Kubernetes secret existing in your cluster. The Kubernetes secret must contain the CA Root Certificate your observability backend trusts. - mTLS
- Selecting mTLS shows a Server Verification field, where you must select either Insecure or Secure. Use the table below to follow the options that result from your choice:
-
Server Verification Fields to configure Insecure You send your distributed tracing data encrypted. The server verifies your client certificate, but the OTEL Collector skips verification of the server's certificate. A TLS Configuration field appears where you must select one of the following options: Upload Certificates Opens two new fields: Client Certificate (PEM) You must enter your client certificate in PEM format. See your observability backend's documentation for instructions on how to generate and obtain a client certificate they will trust. Client Private Key (PEM) You must enter the client private key in PEM format. This is the private key that corresponds to your client certificate. See your observability backend's documentation for instructions on generating this key pair.
Kubernetes Secret Reference Opens a Client TLS Secret Name field where you must enter the name of a Kubernetes Secret existing in your cluster. The Kubernetes secret must contain the client certificate and the client private key. Secure You send your distributed tracing data encrypted, and the observability backend's host-name and server certificate are verified. When you select Secure, a new TLS Configuration field appears. You must select one of the following options: Upload Certificates Opens three new fields: CA Root Certificate (PEM) You can optionally enter the CA Root Certificate provided by your observability backend in PEM format. This is only required if your backend uses a certificate from a private or custom CA. Client Certificate (PEM) You must enter your client certificate in PEM format. See your observability backend's documentation for instructions on how to generate and obtain a client certificate they will trust. Client Private Key (PEM) You must enter the client private key in PEM format. This is the private key that corresponds to your client certificate. Kubernetes Secret Reference Opens two new fields: CA Root Secret Name Enter the name of a Kubernetes Secret that already exists in your cluster and contains the CA Root Certificate your observability backend trusts. Client TLS Secret Name Enter the name of a Kubernetes Secret that already exists in your cluster and contains the client certificate and the client private key.
Creating a Telemetry Profile
The telemetry profile provides the information that your distributed tracing configuration requires to deploy the Collector and Receiver for your event broker service.
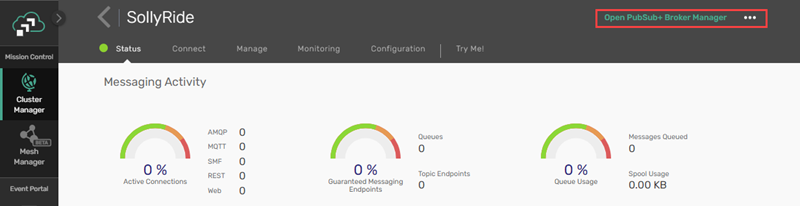
- From the Cluster Manager in the Cloud Console, select an existing service, then click More Actions and select Open Broker Manager.
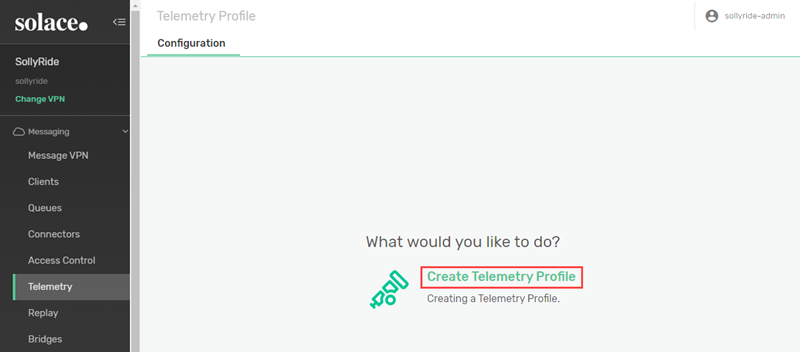
- In Broker Manager, click the Telemetry tab in the navigation bar and then click Create Telemetry Profile to open the New Telemetry Profile page.
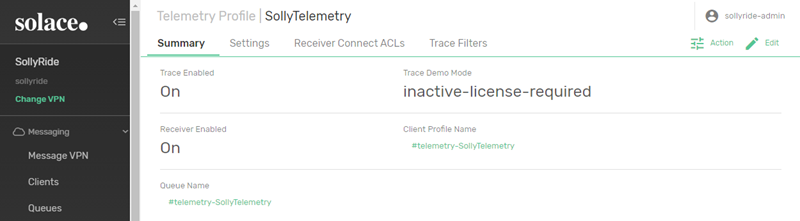
- Fill the following fields on the New Telemetry Profile page:
- Telemetry Profile—Enter a name for the telemetry profile.
- Trace—Click to set to Enabled.
- Receiver—Click to set to Enabled.
Optionally, fill the queue-related fields:
- Maximum Consumer Count—Define the maximum number of consumer flows that can bind to the queue.
- Message Queued Quota—Define the maximum message spool usage allowed by the queue, in megabytes (MB).
Optionally, click Show Advanced Settings to access settings such as alert thresholds and TCP settings for the receiver and alert thresholds for the queue.
-
After completing the fields, click Apply to create the telemetry profile and return to the Telemetry Profile page.
- Click the Trace Filters tab and then click + Trace Filters to open the Create Trace Filters dialog.
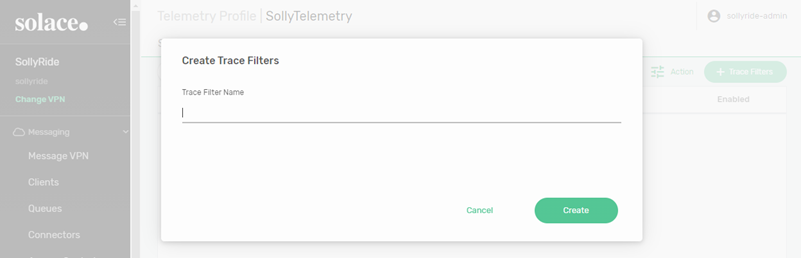
- In the Trace Filter Name field, enter a name for the trace filter and click Create.
The Edit Trace Filter Settings page opens.
- Click the Enabled toggle to enable the trace filter and then click Apply.
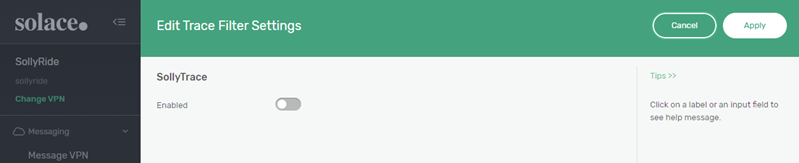
You return to the Telemetry Profile page and Yes appears in the Enabled column for the trace filter you just created.
- Click the trace filter to select it, select the Subscriptions tab, and then click + Subscription.
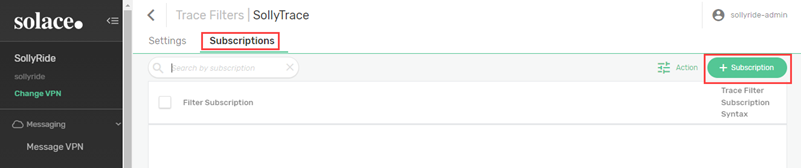
The Create Subscriptions dialog opens.
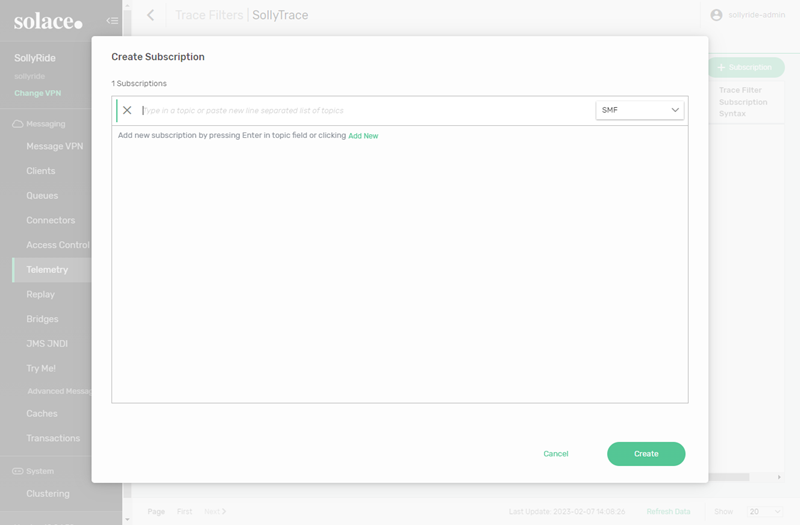
- In the Subscriptions field, enter the subscriptions you want this trace filter to be subscribed to. You can add multiple subscriptions by pressing enter after each entry. You can optionally use the drop-down list to specify the protocol for each subscription—either SMF () or MQTT.
- After adding your subscriptions, click Create.
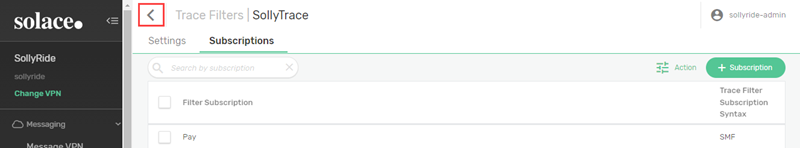
You return to the Subscriptions tab.
- Click the back arrow to return to the Trace Filters tab of the Telemetry Profiles page.
- Select the Receiver Connect ACLs tab and click Edit.
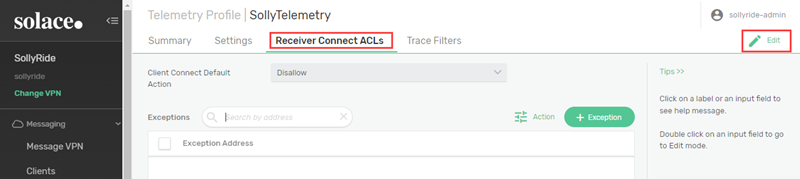
The Edit Receiver ACL Connect Settings page opens.
- In the Client Connect Default Action list, select Allow.
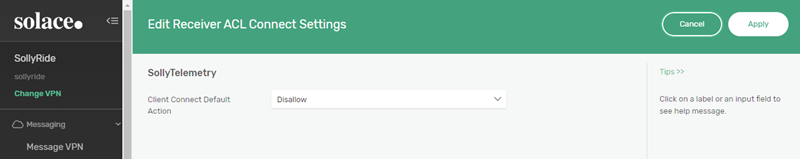
- Click Apply.
You return to the Telemetry Profile page and your telemetry profile is ready to use once you enable distributed tracing on your event broker service. See Enabling Distributed Tracing for an Event Broker Service for more information.
Editing a Telemetry Profile
You can edit the various components of a telemetry profile that you have created. This does not affect the behavior of existing event broker services that have deployed distributed tracing using that telemetry profile. If you want the changes that you make to affect existing event broker services with distributed tracing, you must redeploy distributed tracing for the event broker services using the updated telemetry profile. See Enabling Distributed Tracing for an Event Broker Service for details.
- From the Cluster Manager in the Cloud Console, select an existing service. Click Open Broker Manager and select the Telemetry tab.
- Using the Settings, Receiver Connect ACLs, and Trace Filters tabs, navigate to the component you want to edit and click Edit
 .
. - Make the changes that you want and click Apply.
Deleting a Telemetry Profile
You can delete a telemetry profile you have created. You should note that deleting a telemetry profile does not affect any event broker services that had deployed distributed tracing using that telemetry profile, but future distributed tracing deployments cannot use that telemetry profile. This action is permanent and cannot be reversed.
- From the Cluster Manager in the Cloud Console, select an existing service.
- Click Open Broker Manager and select the Telemetry tab.
- Click
 Action and select
  Delete.
A confirmation window appears.
- Click OK.
Enabling Distributed Tracing for an Event Broker Service
After you have created a tracing destination and telemetry profile, you are ready to enable distributed tracing for your event broker service.
- Log in to the Solace Cloud Console if you have not done so yet. The URL to access the Cloud Console differs based on your
- On the navigation bar, select Cluster Manager
 .
. - Select the event broker service that you want to configure. If the event broker service is not listed, make sure you have the right environment selected. For more information, see Selecting Environments.
- On the Service Details page, click the Manage tab.
- On the Management Settings menu, select Observability.
- On the Distributed Tracing tile, click Enable. A message appears, indicating that a license is being deployed to the event broker service. After the operation completes, a Disable button replaces the Enable button and a Deploy Configuration button appears.
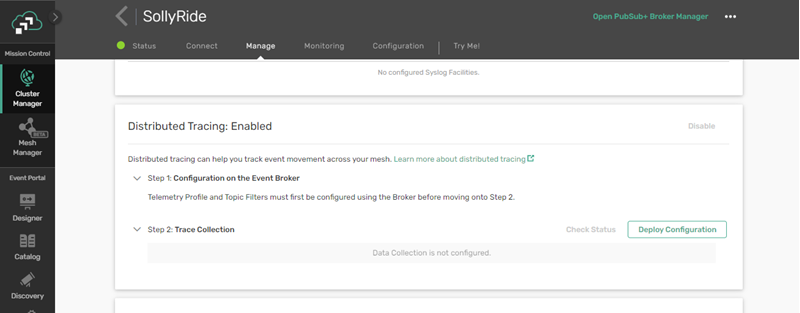
- Click Deploy Configuration to open the Configure Data Collection dialog.
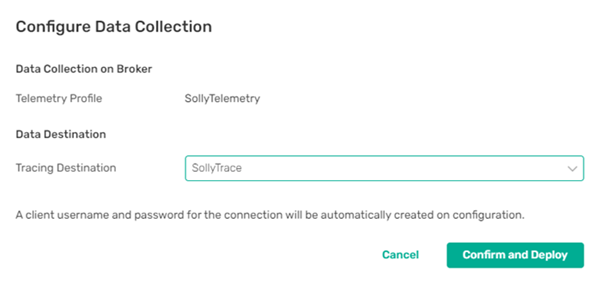
- Click Confirm and Deploy. Note that if you have multiple tracing destinations created, you must use the Tracing Destination field to select the tracing destination for the event broker service and then click Configure and Deploy. A tracing destination and telemetry profile must already exist. See Creating a Tracing Destination and Creating a Telemetry Profile for details.
You return to the Manage tab and a Configuration in progress status appears below Step 2: Trace Collection. The configuration can take up to several minutes to complete and will remain in the Configuration in progress state until finalized. Active appears after configuration is complete.
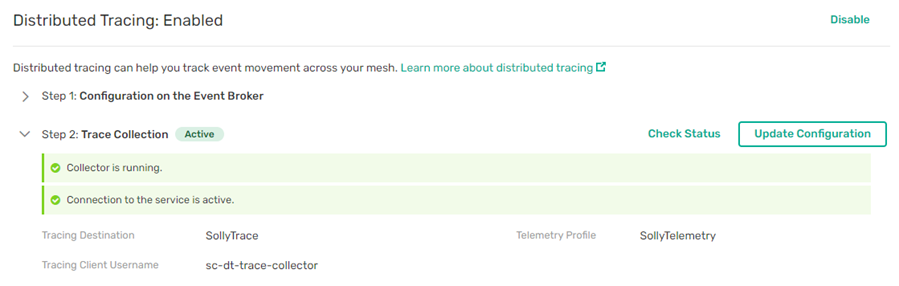
You should note that enabling Distributed Tracing creates a new sc-dt-trace-collector client username for your event broker service. You can view the new client username in Broker Manager on the Clients and Access Control tabs.
Do not delete or edit the client username. Doing so will cause your distributed tracing configuration to fail. See Using Client Profiles and Client Usernames for more information.
You can disable distributed tracing for an event broker service. See Disabling Distributed Tracing.
Using Distributed Tracing with a Proxy in a Customer-Controlled Cluster
Distributed tracing supports only HTTP or HTTPS proxies.
You can use distributed tracing with a proxy in a Customer-Controlled Cluster. This allows you to monitor the messages that travel through your estate while benefiting from the enhanced security features a proxy provides for your deployment. Using distributed tracing with a proxy is a hands-off experience: When you enable distributed tracing, the distributed tracing collector gets your proxy configuration from the Mission Control Agent during initialization. Besides meeting the prerequisites listed in the following section, no additional configurations outside of those detailed in this article are required.
This section provides information on using a proxy with distributed tracing in a Customer-Controlled Cluster, including:
-
Prerequisites for Using a Proxy in a Customer-Controlled Cluster
-
Configuring Proxy Exclusions for Distributed Tracing in a Customer-Controlled Cluster
Prerequisites for Using a Proxy in a Customer-Controlled Cluster
To use distributed tracing with a proxy in your Customer-Controlled Cluster, you must configure the proxy in your environment so that it does not block the tracing headers. This ensures the distributed tracing spans reach their destination.
Proxy Interaction with OTLP Tracing Destination TLS Certificate Verification
If you are using a TLS-intercepting proxy (also known as SSL inspection or man-in-the-middle proxy) in your Customer-Controlled Cluster, be aware that this can affect the certificate verification behavior for your OTLP tracing destinations.
TLS-intercepting proxies terminate the TLS connection from the distributed tracing collector and establish a separate TLS connection to the destination endpoint. This means:
-
The collector sees the proxy's certificate, not the destination endpoint's certificate.
-
Certificate verification using an uploaded CA certificate may not work as expected, because the certificate chain presented to the collector is controlled by the proxy, not the destination.
-
In environments with TLS-intercepting proxies, you may need to either exclude the endpoint from proxy interception or use the Insecure connection security instead of Secure, even if you have the destination's CA certificate.
If your proxy performs TLS interception and you must verify the destination endpoint's certificate:
-
Consider excluding your OTLP endpoint from proxy interception (using the
NO_PROXYexclusion list). See Configuring Proxy Exclusions for Distributed Tracing in a Customer-Controlled Cluster. -
Alternatively, upload your proxy's CA certificate instead of the destination's CA certificate, so the collector can verify the proxy's certificate chain.
If you are unsure whether your proxy performs TLS interception, consult your network or security team.
Configuring Proxy Exclusions for Distributed Tracing in a Customer-Controlled Cluster
Solace can optionally configure your Mission Control Agent to use the NO_PROXY environment variable to allow you to define an exclusion list so the distributed tracing collector can selectively bypass proxy routing for specific destinations while maintaining proxy routing for all other traffic. This is useful when you need to send traces to internal or on-premises systems that should not route through your corporate proxy, while still routing external services through the proxy for security compliance.
Configuring Distributed Tracing to Use a Proxy
To configure distributed tracing to use a proxy, perform the following steps:
- Contact Solace and indicate that you want to use distributed tracing with a proxy. Include a list of exclusions if you want to use a
NO_PROXYexclusions list. - Solace notifies you when we have updated the
values.yamlfile for your Datacenter. - Log into the Cloud Console and download the updated
values.yamlfile. - Reinstall the Mission Control Agent using the updated
values.yamlfile. - Redeploy the distributed tracing collector.
After you have reinstalled the distributed tracing collector, the configuration persists across upgrades and restarts. You may need to reinstall the Mission Control Agent or redeploy the collector in the scenarios outlined below.
Redeploying the Collectors Due to Proxy Changes
If either of the following situations occur, you must redeploy the collectors by updating your distributed tracing configuration:
-
If any changes are made to the proxy configurations contained in the Mission Control Agent, including any
NO_PROXYexclusion updates. -
If you remove the proxy from your deployment.
To update your distributed tracing configuration see Checking Status and Updating Distributed Tracing.
Supported NO_PROXY Exclusion Formats and Examples
You must provide a list of NO_PROXY exclusions to Solace. The NO_PROXY environment variable supports the following formats as a comma-separated list:
- Domain names:
internal-splunk.company.com,monitoring.local - Wildcard domains:
*.internal.company.com,.svc.cluster.local - IP addresses:
10.102.219.116,192.168.1.50 - CIDR notation:
10.0.0.0/8,172.16.0.0/12 - Special values:
localhost,127.0.0.1
Below is an example of how a proxy with NO_PROXY exclusions configured may appear:
- Bypass Proxy for Internal Splunk
proxy:
 ivmr:
  enabled: true
 host: corporate-proxy.company.com
 port: "8080"
 protocol: http
 distributedTracing:
  noProxy:
   enabled: true
   hosts:
    - localhost,127.0.0.1
    - .svc.cluster.local,internal-splunk.company.com
Checking Status and Updating Distributed Tracing
You can check the status of distributed tracing on an event broker service. Checking the status allows you to troubleshoot any issues with distributed tracing function or performance. You can also update the distributed tracing configuration for the event broker service from the same window.
- Log in to the Solace Cloud Console if you have not done so yet. The URL to access the Cloud Console differs based on your
- On the navigation bar, select Cluster Manager .
- Select the event broker service that you want to configure. If the event broker service is not listed, make sure you have the right environment selected. For more information, see Selecting Environments.
- On the Service Details page, click the Manage tab.
- On the Management Settings menu, select Observability.
- Active—Trace collection is active and trace events are being collected and delivered to your OpenTelemetry backend.
- Pending—Trace collection is pending. The status of distributed tracing is being queried or changes are being applied.
- Failed—Trace collection is not occurring. This status occurs for one or more of the following reasons:
- The collector is down.
- The event broker service cannot be found.
- There was a timeout trying to connect to the event broker service.
- A connection cannot be made to the event broker service.
- Optionally, you can update the distributed tracing configuration for the event broker service. If you choose to update the distributed tracing configuration for an event broker service, it updates all distributed tracing information, including any changes made to the telemetry profile and tracing destination. Updating the configuration may also resolve any failed status checks.
To update the distributed tracing configuration, click Update Configuration to open the Configure Data Collection dialog. If you have more than one tracing destination configured for the account, the Tracing Destination field shows the tracing destination assigned to the event broker service. You can change the tracing destination by selecting a different one from the drop-down list.
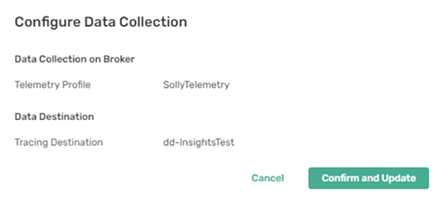
- Click Confirm and Update.
Trace collection can have one of the following statuses:
The status beside Step 2: Trace Collection displays Pending. When the update is complete, the status changes to one outlined in step 3. If the tracing status continues to return a failed state, contact Solace for support.
Disabling Distributed Tracing
You can disable distributed tracing for an event broker service. Doing so releases the distributed tracing license so another event broker service can use it. It also releases the collector, removing the telemetry profile you created for the event broker service. It does not affect the tracing destination.
- Log in to the Solace Cloud Console if you have not done so yet. The URL to access the Cloud Console differs based on your
- On the navigation bar, select Cluster Manager .
- Select the event broker service that you want to configure. If the event broker service is not listed, make sure you have the right environment selected. For more information, see Selecting Environments.
- On the Service Details page, click the Manage tab.
- On the Management Settings menu, select Observability.
- On the Distributed Tracing tile, click Disable.
A message appears indicating that the license is being redeployed. When the disable operation is complete, an Enable button appears.
Using the Solace Event Broker CLI to Enable Distributed Tracing for an Event Broker Service
You can configure and enable distributed tracing for event broker services using the Solace Event Broker CLI if you have it enabled. For details see Enabling the Solace Event Broker CLI for Event Broker Services.
To get started, you must log in to the CLI using a terminal like PuTTY and provide the following commands:
SolaceCLI> enable
SolaceCLI# configure
The remaining steps are identical to those used to configure distributed tracing for a software event broker. See Configuring Distributed Tracing for information.
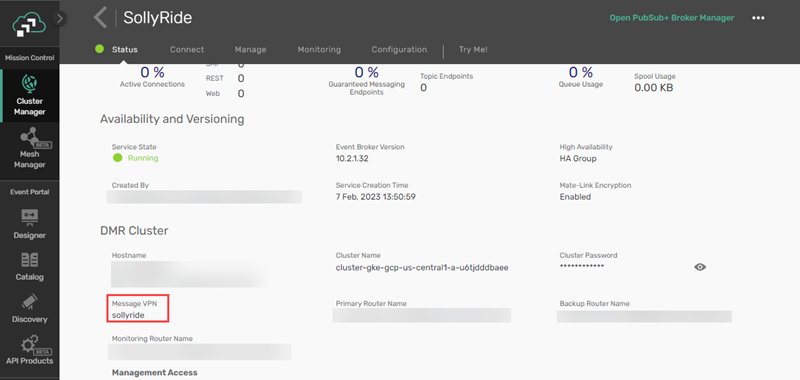
You should note that while event broker services in Solace Cloud are scoped to only one message VPN, you must still provide the Message VPN name when using the Solace Event Broker CLI to set up distributed tracing for the event broker service. You can locate the name of the Message VPN for your event broker service by selecting your service from Cluster Manager and looking in the DMR Cluster section of the Status tab.
For instructions, see Configuring Distributed Tracing.