Insights Overview
Solace Insights enables your operations and application teams to ensure your event brokers and event mesh infrastructure are available and ready for use by business applications, with centralized, at-a-glance status on the availability of various aspects
- resource usage
- event mesh health
- message flow
- high availability (HA) status
- queue, topic endpoint, RDP, and bridge health
- message spool utilization
- capacity utilization
Using Insights provides a turnkey monitoring service to which you can subscribe. The service helps you build an understanding of your estate. An estate refers to your deployment of event brokers, the messaging and activities that occur, and any capabilities that are part of your Solace Cloud account. Insights helps you to:
- Keep your applications and event broker services running optimally as key performance indicators (KPIs), metrics, and events let you understand performance, usage, and proactively detect and address issues in your event-driven architecture (EDA).
- Better understand application behavior and size your event broker services from one place. You can see misconfigurations, understand how events flow between applications, better monitor your applications, and understand the performance of your EDA.
Insights allows you to:
- See visualizations that include account-level dashboards, service-level dashboards, and access to advanced monitoring with Insights. For advanced monitoring, you can also create custom monitors and dashboards to align with your organization's monitoring requirements. For more information, see Solace Insights Visualizations and Dashboards.
- Configure e-mail notifications of when an occurrence happens in your estate. For more information, see Notifications.
- Access to event broker service logs and the rich metrics collected in Insights. For more information, see Logs and Metrics.
- Access to Solace Insights monitors for Datadog that leverage best practices and event monitoring expertise. These monitors are used in Solace Insights dashboards and are available for custom dashboards you can create. For more information, see Solace Insights Monitors for Datadog.
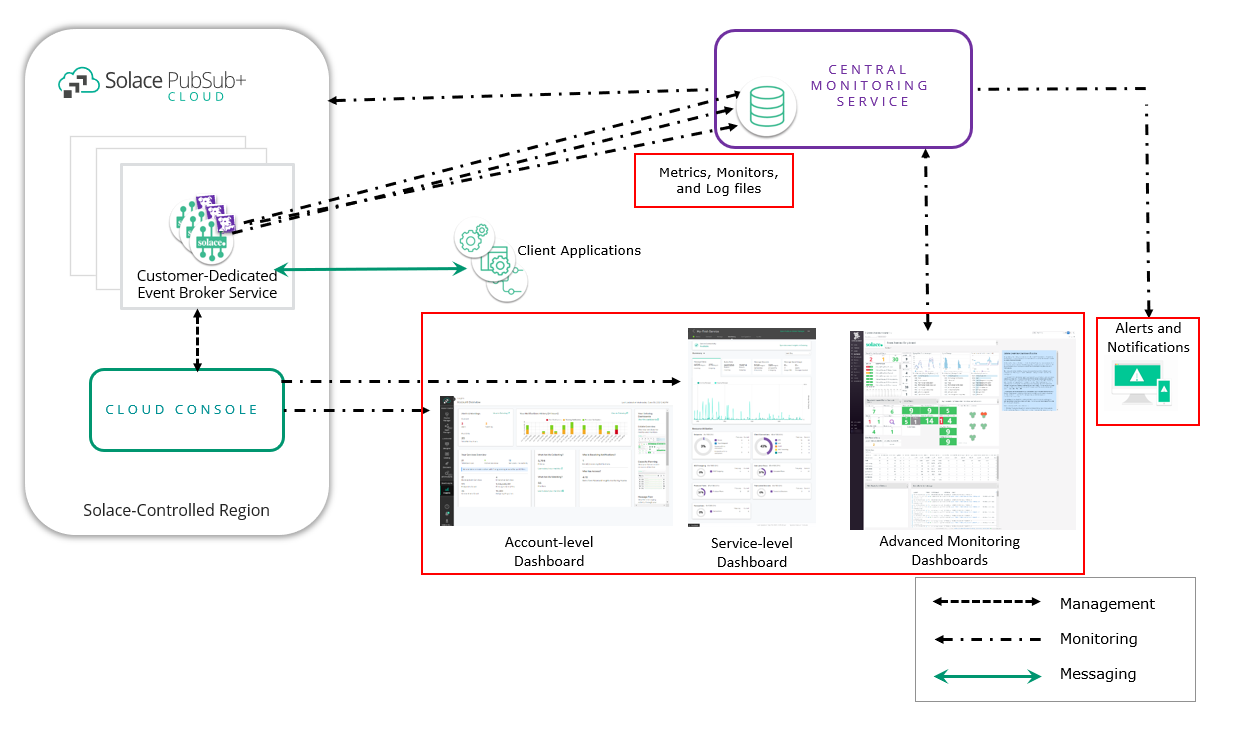
The collection and storage of the metrics and logs are handled by a centralized monitoring service that's part of the Insights service called Datadog (third-party provider). Insights uses the metrics, logs, and monitors to provide both visualizations as account-level and service-level dashboards which are available in the Solace Cloud Console. The Solace Insights dashboards that are accessible in Datadog by default provide advanced monitoring capabilities that can be optionally enabled for individual users in the Solace Cloud account.
In the following diagram, you can see the logs, notifications and alerts, and dashboards available.
If you have an existing monitoring system, you may find that the out-of-the-box visualizations and email notifications that come with Insights are complementary to your existing monitoring system.
For a quick walk-through of what Insights offers, see the following video:
Solace Insights Visualizations and Dashboards
Solace Insights takes care of collecting metrics to build visualizations and useful dashboards for you to best monitor your EDA. These visualizations and dashboards let you see historical and real-time metrics for your event broker services and access system log and event broker service logs. This can help you to better monitor, operate, and capacity plan your event broker services and event meshes.
Insights has three levels of dashboards that include:
- Account-Level
- In the Solace Cloud Console, this high-level dashboard summarizes the important aspects in your account (Workspace).
-
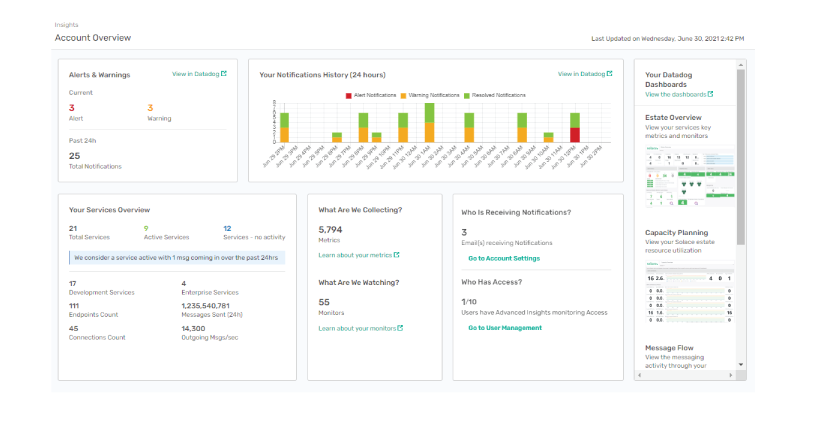
- This dashboard is available to all users when the account is subscribed to Solace Insights. It provides an overview of usage and links to the Solace Insights dashboards for Datadog with advanced information that is available when Advanced Monitoring is enabled. For more information, see Using the Account Overview Dashboard.
- Service-Level dashboards for event broker services
- In the Cloud Console, there is a dashboard available in Cluster Manager on the Monitoring tab for each event broker service.
-
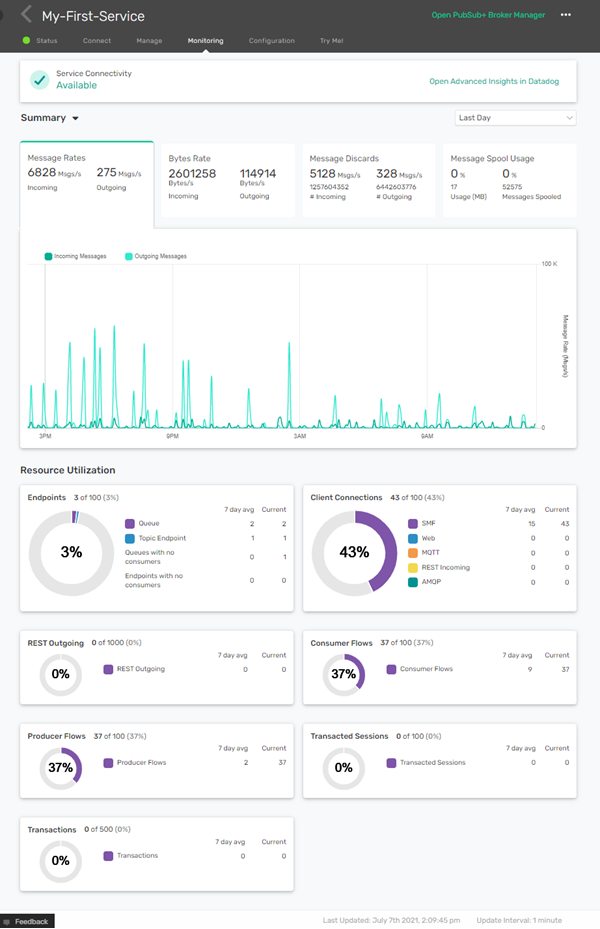
- Data is visible only when the account is subscribed to Insights. This dashboard is available to all users with access to view and edit event broker services in Cluster Manager. From this dashboard, you can see visualizations and graphs for various aspects of the event broker service. For more information, see Using Service-Level Dashboards for Event Broker Services.
- Advanced Monitoring Dashboards
- With Insights, Advanced Monitoring is available when a role is assigned to a user. The set of Solace Insights dashboards for Datadog are available as soon as a user is assigned the Insights Advanced Manager, Insights Advanced Editor, or Insights Advanced Viewer role.
- The Solace Insights dashboards have advanced visualizations that permit the user to see across all event broker services and to dive deeper into all of the information collected from the event broker services.
- The Solace Insights dashboards are accessed from a Datadog account provided with a Solace Insights subscription and is separate from any existing Datadog accounts that you may have.
-

- The advanced dashboards offer greater scale, scope, granularity, and interactivity. They let you improve your understanding of various aspects of your EDA that include capacity, message flow trends, queues, and endpoints usage. You can also create custom dashboards to monitor key metrics and manage the KPIs that are critical to your business. Advanced Monitoring provides improved capabilities to detect issues, recover from them, and monitor performance at a granular level. These dashboards leverage Solace's best practices and expertise to monitor event broker services. To access Advanced Monitoring, you must enable it for each user in your account (i.e., the Insights Advanced Manager, Insights Advanced Editor, or Insights Advanced Viewer role assigned to the user). For more information, see Solace Insights Advanced Monitoring.
Notifications
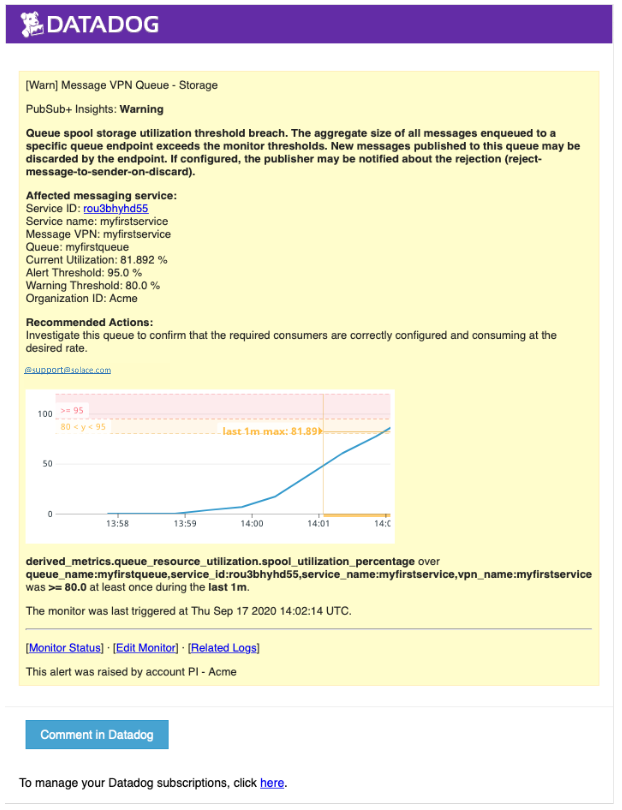
The monitors, log files, and metrics collected from event broker service are also used to provide alerts and warnings in the configurable notifications. When enabled, Solace Insights allows you to send email notifications to notify people when certain events occur, key performance indicators are approached, or when thresholds are exceeded. The email is from Datadog, the third-party provider. An email for a notification looks like the following:
On your Solace Cloud account, you can configure who receives the email notifications in the Solace Cloud Console as shown below:
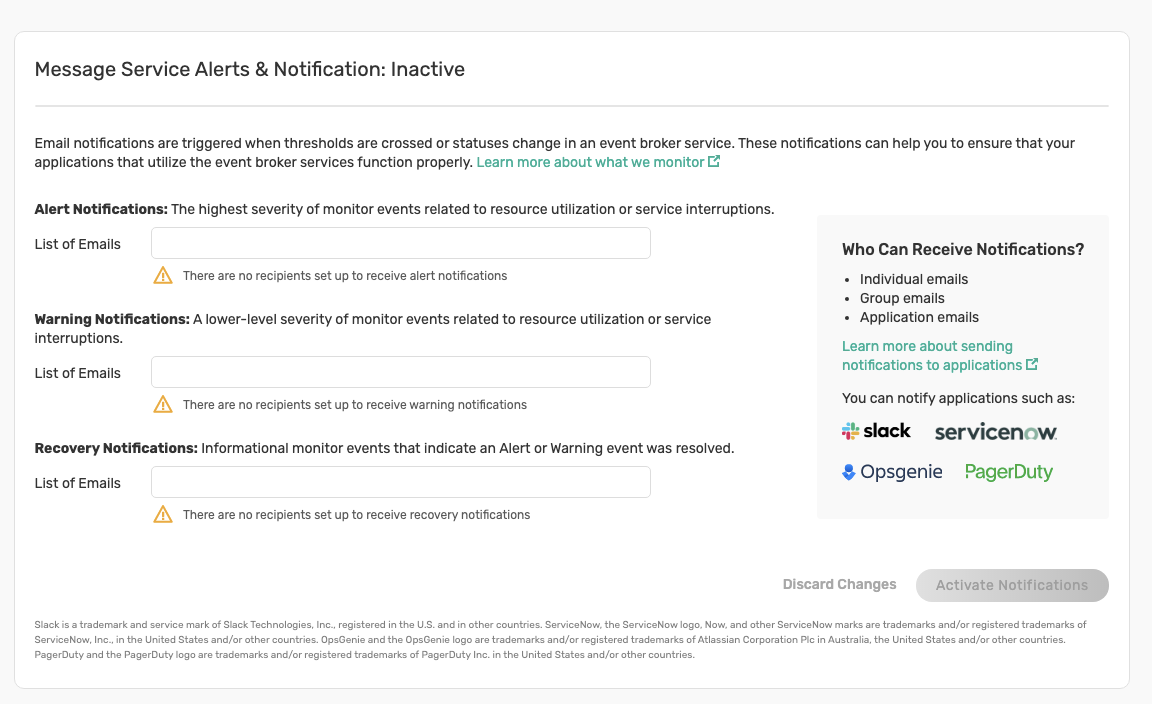
For more information about configuring and using notifications in Insights, see Understanding Insights Notifications.
Logs and Metrics
Central to Solace Insights are the hundreds of metrics and many log files (system, command, and event logs) from event broker services that are collected. These metrics and logs are used by the many Solace Insights monitors for Datadog that are provided as part of Insights that map to key-performance indicators and best-practices for monitoring event broker services and event-driven architectures. Datadog, a third-party, centralized monitoring service, handles the collection and storage of metrics and logs.
Though you could use the Syslog Forwarding feature available in our platform to forward all of the logs to process and visualize the information in your own monitoring system, it won't include the many metrics and monitors that Insights provides. You may find that using Insights provides deeper monitoring capabilities that complement your existing monitoring system.
With Insights, logs and metrics are accessible from a set of Solace Insights dashboards for Datadog to permit you to view a log for up to 30 days (90 days upon request). You can search metrics based on relevant tags.
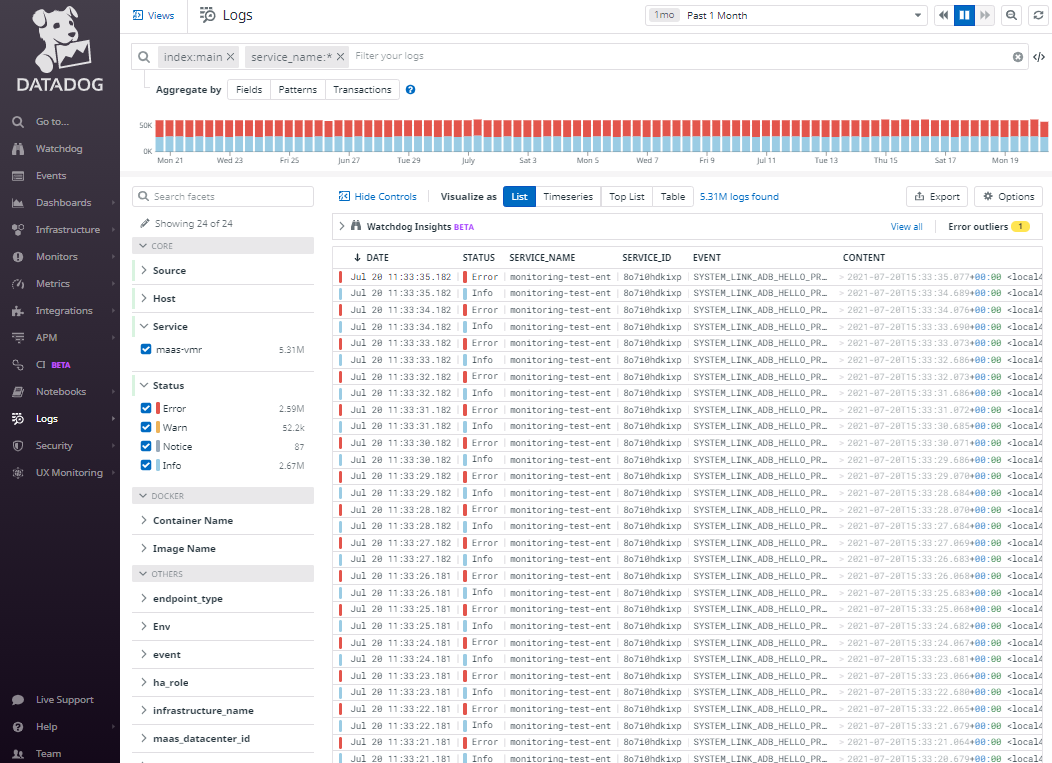
For example, with Insights, you can view the logs collected from your estate directly as shown below from the Estate Overview dashboard.
The collected metrics contain derived and statistical information from the event broker services in your estate. You can further investigate the metrics within Datadog by navigating to Metrics > Summary and then clicking on a metric, as illustrated below:

For detailed information about the metrics, see Solace Insights Metrics and Checks.
Solace Insights Monitors for Datadog
Along with the metrics and logs, Solace Insights includes pre-created Solace Insights monitors for Datadog. There are over 50 monitors available with Insights and these monitors provide you with pre-canned best practices for event monitoring. The best practices leverage knowledge from Solace's broad customer base and from subject-matter experts so that you can effectively manage your event-drive architecture.
These are the basic types of monitors available:
- Log-based — These monitors evaluate key logs from the event broker services and are triggered when those specific logs are seen.
- Metric-based — These monitors evaluate metrics collected from the event broker services and are triggered based on thresholds. These monitors measure utilization as a percentage of available capacity.
- Status-based — These monitors evaluate status. This can be simple status of whether something is up or down or they may be derived.
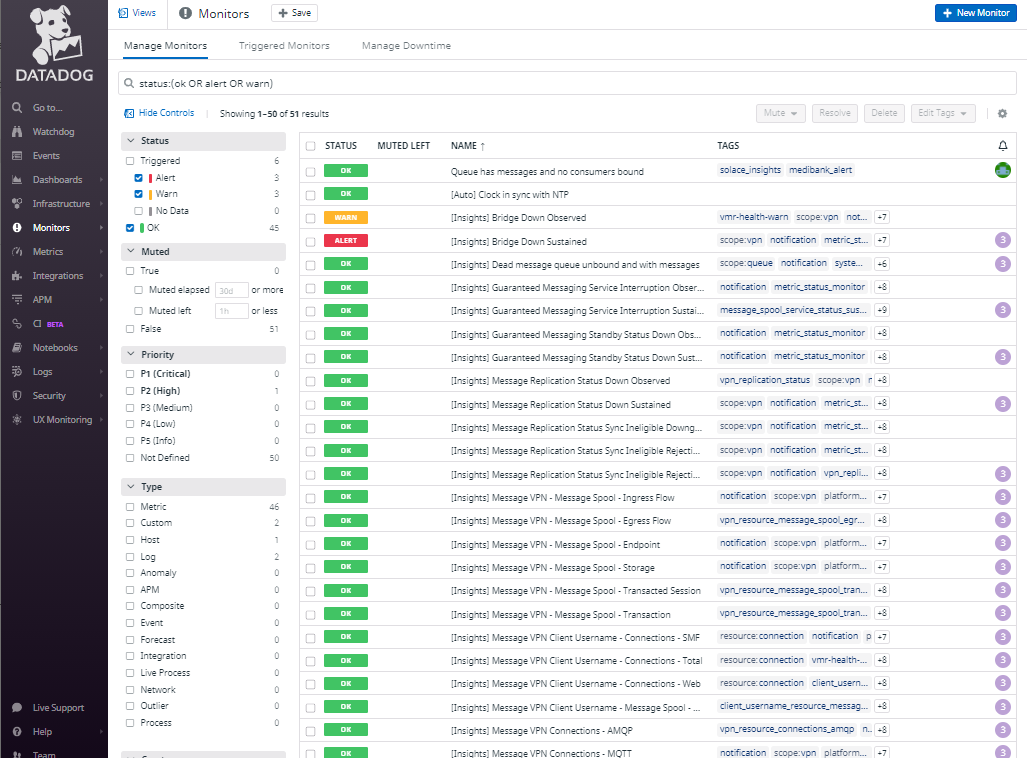
Many of the Solace Insights monitors are pre-configured with thresholds to send alerts and warnings. You can clone the Solace Insights monitors and then change them (e.g., modify the thresholds) to create customized monitors of your own. Solace also provides several sample template monitors which you can clone and customize in order to monitor specific information relevant to your business. Users can see the monitors in the Monitors page in their Datadog account when they have the Insights Advanced Manager, Insights Advanced Editor, or Insights Advanced Viewer role assigned as a role, as shown here:
For information about Solace Insights monitors and customizing monitors, see Solace Insights Monitors for Datadog Reference and Creating Custom Monitors, respectively.
Debug and Troubleshoot with Event and System Logs
The combination of logs, metrics, notifications, and customizable monitors that come with Solace Insights provide powerful debugging and troubleshooting tools that can help identify problems you may encounter with your event broker services. With Insights' access to both
For example, you have setup a new event broker service, but your clients appear to be having problems connecting to it. Worse, you only find out after hours or days. You can use the Insights access to Datadog and search the logs. There you may find the SYSTEM_CLIENT_CONNECT_FAIL event show up in the logs, after the fact.

Clicking on an instance of the event in the log provides information about that instance, allowing you to address the issue. However, with Insights Advanced Monitoring, you can be proactive and create a monitor to catch this type of event, or other events that may affect your organization as they occur, allowing you to be informed and address problems proactively when they arise. Insights Advance Monitoring offers a range of events you can monitor, divided into three broad categories:
- Client events
- System events
- VPN events
The individual events in each of these categories are detailed in the Event Log Descriptions .
After seeing this event show up in your logs you decide to create your own monitor as outlined in Cloning and Customizing Template Monitors
. Your new monitor is customized to trigger whenever the SYSTEM_CLIENT_CONNECT_FAIL event occurs. Instead of waiting and searching through logs when problems are noticed, you (or the people you choose) are now notified immediately so action can be taken in a timely manner.
With Insights Advanced Monitoring you can design an array of custom monitors to deal with these events that may affect your organization and it's event broker services as they occur. You can be informed immediately when these events happen and troubleshoot them as they arise.
Forward Solace Insights Data to Third-Party Observability Platforms
You can forward metrics and logs collected by Solace Cloud as part of your Insights subscription to other observability platforms, or to your own Datadog account. For more information, see Forwarding Solace Insights Metrics and Logs.
Solace Insights for Self-Managed Event Brokers
The monitoring capabilities of Solace Insights aren't limited to event broker services. You can use the many monitoring benefits provided by Insights with your self-managed Solace Software Event Broker deployed in Docker, Podman, or Kubernetes, or as a Controlled Availability feature, your Solace Appliance Event Broker. Monitoring your event broker's metrics and logs using the full suite of Insights dashboards and monitors provided with your Insights Datadog account provides powerful visualizations of your event broker's usage and activity.
The Insights Agent automatically detects your event broker type and provides broker-type-specific metrics, monitors, and dashboards. For more information, see Insights for Self-Managed Event Brokers.