Solace Insights Monitors for Datadog Reference
Solace Insights Monitors for Datadog uses Datadog monitors that are triggered to provide notifications when thresholds occur. Datadog monitors are part of the Datadog cloud application used by Solace as a central monitoring service to monitor
Monitors can be configured to trigger notifications that include Alerts, Warnings, and Information (severity types). The severity triggered depends on how the monitor is configured. Not all monitors are configured to trigger notifications of all severity types, and in some cases, do no trigger any notifications at all. Notifications that are triggered can be based on specific events that are being monitored for in the logs, the metrics (statistics collected from
There are three user roles that can be assigned to users with an Insights subscription: The Insights Advanced Manager, Insights Advanced Viewer and Insights Advanced Editor.
-
The Insights Advanced Viewer user role provides the ability to see status views of the various Solace Insights monitors.
-
The Insights Advanced Editor user role provides the ability to view and manage the Solace Insights monitors using the Datadog Web Application.
-
The Insights Advanced Manager user role provides the ability to view and manage the Solace Insights monitors using the Datadog Web Application. The Insights Advanced Manager can also manage Datadog API and APP keys, and Datadog Integrations. For more information, see Insights Advanced Manager Role.
The screenshot below shows an example of how a monitor status and history may appear in Datadog.
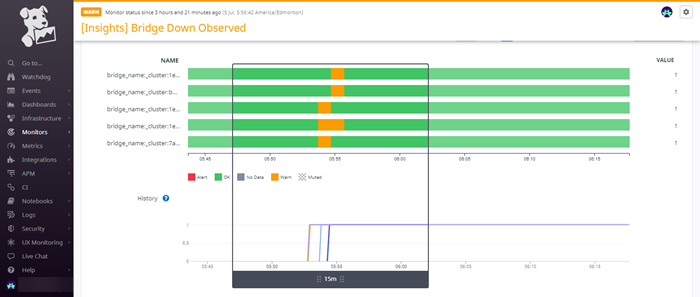
For more general information about Solace Insights monitors see Datadog's help about Getting started with Monitors, and for more detailed information see their help about Alerting.
Note that a sample template monitor is provided so that you can create monitors to meet your specific needs. The logs you can use in this monitor are listed in a separate table following the table with monitor information, for more information see Event Log Descriptions .
Below you will find the following:
-
Available Insights Monitors—A list of available Solace Insights monitors, with links to tables containing information about each monitor, and a section explaining how you can interact with the monitors.
-
Event Log Descriptions —Descriptions of event logs used in some of the Solace Insights monitors.
-
System Logs —Information about, and links to the system logs that you can use to create your own monitors.
Available Insights Monitors
Use the links below to view the tables of available Insights monitors you can use in your dashboards:
- Appliance Hardware Health—Monitors hardware health metrics for appliance event broker.
- Cache Instance—Monitors metrics related to cache instance metrics.
- Certificate Expiry Monitoring—Monitors for tracking certificate expiration across your
- Client Username—Monitors metrics related to client usernames.
- Event Broker Logs—Monitors for specific logs.
- Kafka Metric Monitors—Monitors specifically for Kafka bridges.
- Message VPN—Monitors that check Message VPN-level metrics.
- Metric Quota Monitors—Monitors for reviewing metric limit usage
- Micro-Integration Monitors—Monitors for Micro-Integration health, processing errors, and DMQ activity.
- Queue—Monitors metrics related to queues.
- Sample Template Monitors—Monitors intended for cloning and configuring for your own uses.
- Scale Capacity—Monitors for providing visibility into proactive capacity utilization trends across your
- System Status—Monitors for system-level metrics and logs related to status.
- Topic Endpoint—Monitors specifically for topic endpoint metrics.
Using Datadog Monitors
Below are instructions for interacting with the various Insights monitors available in your Datadog account, including:
Filtering Monitor Data
You can filter the data provided by the monitors using the Monitor behavior for fields located in the top-left of the monitor page, under the monitor name.
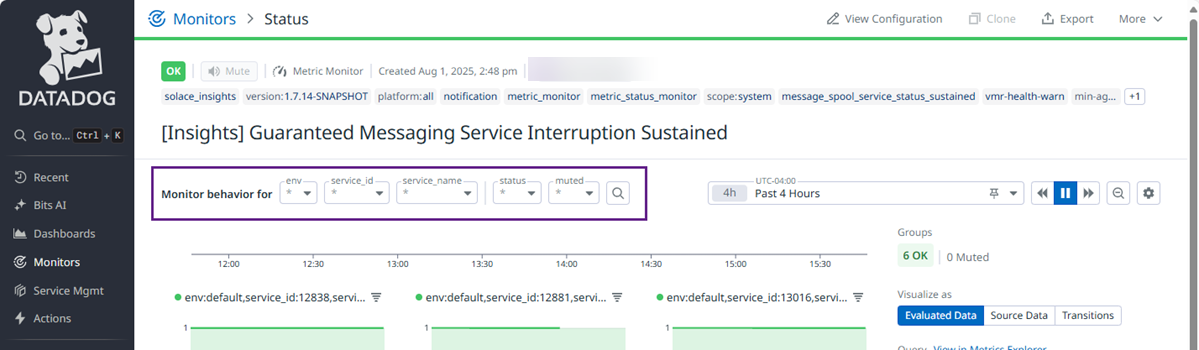
Solace Insights monitors are unfiltered by default, with an asterisk * in each of the Monitor behavior for fields indicating the unfiltered state. You can combine the filters to refine the information shown by the monitor. For example, you could use the env, service_id, and status to filter the monitor to
When using Solace Insights monitors, be aware that the selection you make in one filter affects options available in other filters. For example, if you filter the monitor using the env filter, your options in the other filters, such as service_id will be limited to those
Not all filters are available to all Solace Insights monitors. The following list summarizes the filters that may be available to Solace Insights monitors monitors in general:
env- Allows you to filter the monitor by environment to help you understand information about
service_id- Allows you to filter the monitor by
service_id. You can find the service id at the end of the URL for yourhttps://console.solace.cloud//services/k8vv6x131e1. service_name- Allows you to filter the monitor by the name of the
vpn_name- Allows you to filter the monitor by
status- Allows you to filter the monitor by its status. For more information, see Severity Levels.
muted- Allows you to filter the monitor by the muted state of the monitor. For more information, see Muting Solace Insights Monitors for Datadog.
Understanding Monitor Information
Each monitor provides the following information:
- Monitor Name
- The name of the monitor. This is the name you see in Datadog.
- Severity Levels
- The default severity levels based on the monitor. Each monitor can be one of the following severity levels:
- Alert — The monitor is configured to only trigger when an Alert occurs.
- Warning — The monitor is configured to only trigger when a Warning occurs.
Alert or Warning — The monitor is configured to trigger when a threshold is exceeded. The configured value is a measure of utilization (as a percentage) of the available capacity. The severity is based on these default thresholds:
Warning: 80%
Alert (Critical): 95%
Note that the levels are sample levels in the monitors we provide. If you clone the monitor, you can customize them these levels to meet your requirements. For example, if you could set your Alert to be 90% in your cloned monitor.
Recovery — This monitor is triggered to indicate that it has recovered from a previous Alert or Warning.
No Default Severity — This monitor does not trigger by default. To use this monitor, clone it and then set thresholds for warnings and alerts that match your monitoring requirements.
- Details
- A description of the monitor, the predicted impact if an Alert or Warning is raised, and recommended actions. Included with the details are predicted impact and recommended actions.
- Muted
- Some monitors are muted (or silenced). You can choose to unmute them in the Datadog interface for your estate. For information about muting monitors see Muting Solace Insights Monitors for Datadog.
Event Log Descriptions
The table below lists the various event logs available for you to use with the sample template monitor listed in the table above. The logs in the table have been organized into the following categories:
- Client Event Logs - Monitor system-level metrics and logs related to status.
- System Event Logs - Monitors specifically for system events.
- VPN Event Logs - Monitors that check Message VPN-level metrics.
The table below provides the following information about each log type:
- Log Name
- The name of the log. This is what you will enter into the first field of section one when cloning and creating a monitor, see Cloning and Customizing Template Monitors .
- Default Severity Configured
- The default severity levels are different for each log, and can be either Warn, Notice, or Info.
- Description
- A description of the log, and links to the links to further technical information about each.
You can also use the system logs that are available in your Datadog account when configuring custom monitors. See Cloning and Customizing Template Monitors .
| Log Name | Event Level Severity | Description |
|---|---|---|
| Client Event Logs | ||
| CLIENT_CLIENT_BIND_FAILED | Warn |
This event is sent when a client fails to bind to a message endpoint. Impacts, Recommended Actions, and Message Formatting: See CLIENT_CLIENT_BIND_FAILED in the Syslog Events Reference. |
| CLIENT_CLIENT_CREATE_ENDPOINT_FAILED | Notice |
This event is sent when a message endpoint fails to be created. Impacts, Recommended Actions, and Message Formatting: See CLIENT_CLIENT_CREATE_ENDPOINT_FAILED in the Syslog Events Reference. |
| CLIENT_CLIENT_LARGE_MESSAGE | Notice |
This is a one-shot event sent when the size of an ingress message is larger than that configured through the CLI using the 'message-vpn <> event large-message-threshold' Config CLI command. The message is still processed by the message broker along with the generation of this event. Impacts, Recommended Actions, and Message Formatting: See CLIENT_CLIENT_LARGE_MESSAGE in the Syslog Events Reference. |
| CLIENT_CLIENT_MESSAGE_TOO_BIG | Warn |
This is a one-shot event sent when a direct or guaranteed message size exceeds what is allowed by the message broker. This event is only raised for clients using the SMF protocol. Impacts, Recommended Actions, and Message Formatting: See CLIENT_CLIENT_MESSAGE_TOO_BIG in the Syslog Events Reference. |
| CLIENT_CLIENT_SUBSCRIPTIONS_HIGH | Warn |
This event is sent when the number of subscriptions, for the specified client, rises above the set threshold value. Impacts, Recommended Actions, and Message Formatting: See CLIENT_CLIENT_SUBSCRIPTIONS_HIGH in the Syslog Events Reference. |
| CLIENT_AD_EGRESS_FLOWS_HIGH | Warn |
This event is sent when the number of egress flows for a client reaches or exceeds the set threshold specified by the associated client profile for that client. Impacts, Recommended Actions, and Message Formatting: See CLIENT_AD_EGRESS_FLOWS_HIGH in the Syslog Events Reference. |
| CLIENT_AD_EGRESS_FLOWS_HIGH_CLEAR | Info |
This event is sent when the number of egress flows, for a client, falls below the clear threshold specified by the associated client profile for that client. Impacts, Recommended Actions, and Message Formatting: See CLIENT_AD_EGRESS_FLOWS_HIGH_CLEAR in the Syslog Events Reference. |
| CLIENT_AD_INGRESS_FLOWS_HIGH | Warn |
This event is sent when the number of ingress flows, for a client, reaches or exceeds the set threshold specified by the associated client profile for that client. Impacts, Recommended Actions, and Message Formatting: See CLIENT_AD_INGRESS_FLOWS_HIGH in the Syslog Events Reference. |
| CLIENT_AD_INGRESS_FLOWS_HIGH_CLEAR | Info |
This event is sent when the number of egress flows, for a client, falls below the clear threshold specified by the associated client profile for that client. Impacts, Recommended Actions, and Message Formatting: See CLIENT_AD_INGRESS_FLOWS_HIGH_CLEAR in the Syslog Events Reference. |
| CLIENT_AD_MAX_EGRESS_FLOWS_EXCEEDED | Warn |
This event is sent when the number of egress flows for a client exceeds the maximum number permitted for the client's associated profile. Impacts, Recommended Actions, and Message Formatting: See CLIENT_AD_MAX_EGRESS_FLOWS_EXCEEDED in the Syslog Events Reference. |
| CLIENT_AD_MAX_INGRESS_FLOWS_EXCEEDED | Warn |
This event is sent when the number of egress flows for a client exceeds the maximum number permitted for the client's associated profile. Impacts, Recommended Actions, and Message Formatting: See CLIENT_AD_MAX_INGRESS_FLOWS_EXCEEDED in the Syslog Events Reference. |
| CLIENT_AD_TRANSACTED_SESSIONS_EXCEED | Warn |
This event is sent when the number of transacted sessions, for the specified client, exceeds the total available by the associated client profile for that client. Impacts, Recommended Actions, and Message Formatting: See CLIENT_AD_TRANSACTED_SESSIONS_EXCEED in the Syslog Events Reference. |
| CLIENT_AD_TRANSACTED_SESSIONS_HIGH | Warn |
This event is sent when the number of transacted sessions, for the specified client, reaches or exceeds the set threshold value. Impacts, Recommended Actions, and Message Formatting: See CLIENT_AD_TRANSACTED_SESSIONS_HIGH in the Syslog Events Reference. |
| CLIENT_AD_TRANSACTED_SESSIONS_HIGH_CLEAR | Info |
This event is sent when the number of transacted sessions, for the specified client, falls below the clear threshold value. Impacts, Recommended Actions, and Message Formatting: See CLIENT_AD_TRANSACTED_SESSIONS_HIGH_CLEAR in the Syslog Events Reference. |
| CLIENT_AD_TRANSACTED_SESSION_FAIL | Notice |
This event is sent when a transacted client session fails locally. Impacts, Recommended Actions, and Message Formatting: See CLIENT_AD_TRANSACTED_SESSION_FAIL in the Syslog Events Reference. |
| CLIENT_AD_TRANSACTIONS_EXCEED | Warn |
This event is sent when the number of transactions, for the specified client, exceeds the total available by the associated client profile for that client. Impacts, Recommended Actions, and Message Formatting: See CLIENT_AD_TRANSACTIONS_EXCEED in the Syslog Events Reference. |
| CLIENT_AD_TRANSACTIONS_HIGH | Warn |
This event is sent when the number of transactions, for the specified client, reaches or exceeds the set threshold value. Impacts, Recommended Actions, and Message Formatting: See CLIENT_AD_TRANSACTIONS_HIGH in the Syslog Events Reference. |
| CLIENT_AD_TRANSACTIONS_HIGH_CLEAR | Info |
This event is sent when the number of transactions, for the specified client, falls below the clear threshold value. Impacts, Recommended Actions, and Message Formatting: See CLIENT_AD_TRANSACTIONS_HIGH_CLEAR in the Syslog Events Reference. |
| CLIENT_CLIENT_ACK_NOT_ALLOWED | Notice |
This event is sent when the client does not have the privileges required to consume messages from an endpoint. Impacts, Recommended Actions, and Message Formatting: See CLIENT_CLIENT_ACK_NOT_ALLOWED in the Syslog Events Reference. |
| CLIENT_CLIENT_DISCONNECT | Notice |
This event is sent when a VPN bridge client disconnects from an Impacts, Recommended Actions, and Message Formatting: See CLIENT_CLIENT_DISCONNECT in the Syslog Events Reference. |
| CLIENT_CLIENT_EGRESS_MSG_DISCARD | Info |
This event is generated when a message is discarded because it cannot be sent to a client. However, it is only sent out approximately once every 60 seconds for the specified client. Impacts, Recommended Actions, and Message Formatting: See CLIENT_CLIENT_EGRESS_MSG_DISCARD in the Syslog Events Reference. |
| CLIENT_CLIENT_NAME_CHANGE_FAILED | Notice |
This event is generated when a message is discarded because it cannot be sent to a client. However, it is only sent out approximately once every 60 seconds for the specified client. Impacts, Recommended Actions, and Message Formatting: See CLIENT_CLIENT_NAME_CHANGE_FAILED in the Syslog Events Reference. |
| CLIENT_CLIENT_PARSE_ERROR | Notice |
This is a one-shot event sent when the message broker encounters parsing errors while processing the Solace-specific messaging headers. Impacts, Recommended Actions, and Message Formatting: See CLIENT_CLIENT_PARSE_ERROR in the Syslog Events Reference. |
| System Event Logs | ||
| SYSTEM_CLIENT_CONNECT_FAIL | Info |
This event is sent when a client tries to connect to the message broker but the message broker is unable or unwilling to accept the connection. Impacts, Recommended Actions, and Message Formatting: See SYSTEM_CLIENT_CONNECT_FAIL in the Syslog Events Reference. |
| SYSTEM_AUTHENTICATION_SESSION_DENIED | Notice |
A user has unsuccessfully attempted to authenticate for a CLI, SEMP, shell, scp, or sftp session. Impacts, Recommended Actions, and Message Formatting: See SYSTEM_AUTHENTICATION_SESSION_DENIED in the Syslog Events Reference. |
| SYSTEM_CLIENT_ACL_CONNECT_DENIAL | Info |
One or more client connect attempts were denied in the last 60 seconds due to an Access Control List (ACL) client-connect rule. Impacts, Recommended Actions, and Message Formatting: See SYSTEM_CLIENT_ACL_CONNECT_DENIAL in the Syslog Events Reference. |
| SYSTEM_CLIENT_ACL_PUBLISH_DENIAL | Info |
One or more messages published within the last 60 seconds was rejected on ingress because the topic matched a publish-topic ACL rule. Impacts, Recommended Actions, and Message Formatting: See SYSTEM_CLIENT_ACL_PUBLISH_DENIAL in the Syslog Events Reference. |
| SYSTEM_CLIENT_ACL_SUBSCRIBE_DENIAL | Info |
One or more subscriptions, received from clients within the last 60 seconds, was rejected because the topic matched a subscribe-topic ACL rule. Impacts, Recommended Actions, and Message Formatting: See SYSTEM_CLIENT_ACL_SUBSCRIBE_DENIAL in the Syslog Events Reference. |
| SYSTEM_CLIENT_CONNECT_AUTH_FAIL | Warn |
This event is sent when user authentication fails for a client trying to connect to the message broker. Impacts, Recommended Actions, and Message Formatting: See SYSTEM_CLIENT_CONNECT_AUTH_FAIL in the Syslog Events Reference. |
| SYSTEM_CLIENT_CONNECT_FAIL | Info |
This event is sent when a client tries to connect to the message broker but the message broker is unable or unwilling to accept the connection. Impacts, Recommended Actions, and Message Formatting: See SYSTEM_CLIENT_CONNECT_FAIL in the Syslog Events Reference. |
| VPN Event Logs | ||
| VPN_AD_MSG_SPOOL_REJECT_LOW_PRIORITY_MSG_LIMIT_EXCEED | Warn |
This event is sent when the messages enqueued to a specific endpoint exceeds the configured reject-low-priority-msg-limit. No new low priority messages will be admitted to the endpoint. Impacts, Recommended Actions, and Message Formatting: See VPN_AD_MSG_SPOOL_REJECT_LOW_PRIORITY_MSG_LIMIT_EXCEED in the Syslog Events Reference. |
| VPN_AD_MSG_SPOOL_REJECT_LOW_PRIORITY_MSG_LIMIT_HIGH | Warn |
This event is sent when the messages enqueued to a specific endpoint exceeds the set threshold value of configured reject-low-priority-msg-limit. Impacts, Recommended Actions, and Message Formatting: See VPN_AD_MSG_SPOOL_REJECT_LOW_PRIORITY_MSG_LIMIT_HIGH in the Syslog Events Reference. |
| VPN_AD_MSG_SPOOL_REJECT_LOW_PRIORITY_MSG_LIMIT_HIGH_CLEAR | Info |
This event is sent when the messages enqueued to a specific endpoint falls below the clear threshold value of configured reject-low-priority-msg-limit. Impacts, Recommended Actions, and Message Formatting: See VPN_AD_MSG_SPOOL_REJECT_LOW_PRIORITY_MSG_LIMIT_HIGH_CLEAR in the Syslog Events Reference. |
| VPN_AD_PARTITIONED_QUEUE_REBALANCE_COMPLETED | Info |
This event is sent when a partitioned queue completes scaling its partition count. Impacts, Recommended Actions, and Message Formatting: See VPN_AD_PARTITIONED_QUEUE_REBALANCE_COMPLETED in the Syslog Events Reference. |
| VPN_AD_PARTITIONED_QUEUE_REBALANCE_STARTED | Info |
This event is sent when a partitioned queue starts rebalancing its partitions across connected clients. Impacts, Recommended Actions, and Message Formatting: See VPN_AD_PARTITIONED_QUEUE_REBALANCE_STARTED in the Syslog Events Reference. |
| VPN_AD_REPLAY_STATE_TRANSITION_TO_FAILED | Warn |
This event is sent when a message replay transitions to the failed state. Impacts, Recommended Actions, and Message Formatting: See VPN_AD_REPLAY_STATE_TRANSITION_TO_FAILED in the Syslog Events Reference. |
| VPN_AD_REPLAY_STATE_TRANSITION | Notice |
This event is sent when a message replay transitions to a new state. Impacts, Recommended Actions, and Message Formatting: See VPN_AD_REPLAY_STATE_TRANSITION in the Syslog Events Reference. |
| VPN_BRIDGING_LINK_TTL_EXCEEDED | Warn |
This is a one-shot event message sent when a message has been discarded due to it exceeding the allowed number of bridging hops. Impacts, Recommended Actions, and Message Formatting: See VPN_BRIDGING_LINK_TTL_EXCEEDED in the Syslog Events Reference. |
| VPN_BRIDGING_LINK_TTL_EXCEEDED_CLEAR | Info |
This event message is sent when the one-shot event message VPN_BRIDGING_TTL_EXCEEDED is cleared through the 'bridge <> message-vpn <> clear-event ttl-exceeded' Admin CLU command. Impacts, Recommended Actions, and Message Formatting: See VPN_BRIDGING_LINK_TTL_EXCEEDED_CLEAR in the Syslog Events Reference. |
| VPN_CLIENT_USERNAME_CONNECT_FAIL | Info |
This event message is sent when a client tries to connect to the message broker but the message broker is unable or unwilling to accept the connection. Impacts, Recommended Actions, and Message Formatting: See VPN_CLIENT_USERNAME_CONNECT_FAIL in the Syslog Events Reference. |
| VPN_RDP_RC_DOWN | Warn |
This event message is sent when a REST consumer transitions to the down state. This means all the individual TCP connections to the REST consumer's remote host are down. Thus, the RDP is no longer able to use this REST consumer to send messages to it. The RDP can continue to send messages through its other REST consumers that are up. Impacts, Recommended Actions, and Message Formatting: See VPN_RDP_RC_DOWN in the Syslog Events Reference. |
| VPN_RDP_RC_UP | Info |
This event message is sent when a REST consumer transitions to the up state. This means at least one TCP connection has been established with the REST consumer's remote host. Impacts, Recommended Actions, and Message Formatting: See VPN_RDP_RC_UP in the Syslog Events Reference. |
| VPN_RDP_RC_CONN_DOWN | Warn |
This event is sent when an individual TCP connection of a REST consumer link has failed. The REST consumer may have several such connections. Impacts, Recommended Actions, and Message Formatting: See VPN_RDP_RC_CONN_DOWN in the Syslog Events Reference. |
| VPN_RDP_RC_CONN_UP | Info |
This event is sent when an individual TCP connection of a REST consumer link is established. The REST consumer may have several such connections. Impacts, Recommended Actions, and Message Formatting: See VPN_RDP_RC_CONN_UP in the Syslog Events Reference. |
| VPN_RDP_RDP_DOWN | Warn |
This event message is sent when a REST Delivery Point transitions to the down state. This means all of the RDP's REST Consumers are down or all of the RDP's queue bindings are down. Impacts, Recommended Actions, and Message Formatting: See VPN_RDP_RDP_DOWN in the Syslog Events Reference. |
| VPN_RDP_RDP_UP | Info |
This event message is sent when a REST Delivery Point transitions to the up state. This means at least one of RDP's REST consumers is up and at least one of RDP's queue bindings is up. Impacts, Recommended Actions, and Message Formatting: See VPN_RDP_RDP_UP in the Syslog Events Reference. |
System Logs
You can use the wide array of system, command, and event logs that are collected and available in your Datadog with your Insights account to configure your own custom monitors. For a list of available system logs and information about them, see Syslog Events Reference.
For information about creating your own custom monitors, see Cloning and Customizing Template Monitors .