Viewing Event Broker Services
With the correct permissions, you can view, and manage event broker services. For more information, see Roles and Permissions.
Information Summary on the Service Card
In Cluster Manager, you can display the list of event broker service in the current environment or all environments. You can change the currently selected environment or the option to display all resources by clicking the environment label in the top-right corner, and selecting a different environment. For more information, see Selecting Environments.
By default, each service is represented by a card in Cluster Manager. You can also view services in a list by clicking the List View icon ![]() in the top right corner. See Sorting the List of Event Broker Services for more information.
in the top right corner. See Sorting the List of Event Broker Services for more information.
![]()
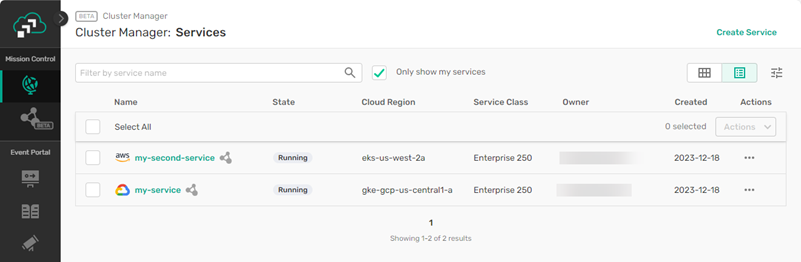
On the card for a service, you can see the following information:
- cloud provider (represented by the icon on the card)
- service class of the event broker service
- service status
- owner of the service
- if the event mesh icon
 appears on the card, the event broker service is part of an event mesh; if you hover over the icon, you can see the name of the event mesh that the service belongs to
 - if you hover above the user icon
 on the card, you can see your permissions for the event broker service
 - Available information and other actions (depending on your permissions) are accessible via clicking Actions
 , including:
- Open Service—information about the event broker service; for more information, see below.
- Edit Service Name—you can change the name of the event broker service. For more information, see Changing the Name of an Event Broker Service.
- Clone Service—clone the event broker service. For more information, see Cloning an Event Broker Service
- Set User Access—with the right permissions, you can set access to the event broker service for other user
- Open Broker Manager—logs you into Broker Manager if you are preauthenticated; for more information, see Pre-Authentication for Broker Manager and Using Broker Manager with Event Broker Services.
- Open Event Mesh—if the event broker service is part of an event mesh, this option is available as a shortcut to see information about the event mesh for which the service belongs; for more information, see Viewing Event Mesh Details
- Delete—delete the event broker service. For more information, see Deleting Event Broker Services
The list view shows the same information in a table-based format, including the environment the service is part of, if you are viewing it in full screen mode. If you have small screen, or are not using the browser full screen, less information is shown. The name, state, service class, actions menu, and mesh icon will be visible, regardless of screen size.
Sorting the List of Event Broker Services
By default, event broker services are shown as groupings of tiles in Cluster Manager. Depending on the number of services in your account, this tile view can be quite large. Instead of viewing your event broker services as tiles, you can click the List View icon ![]() in the top right corner to switch to a list view. The list view shows event broker service in a more compact, table-based format that you may find faster to navigate. Both views offer the same ability to manage your event broker service, and can be filtered and searched.
in the top right corner to switch to a list view. The list view shows event broker service in a more compact, table-based format that you may find faster to navigate. Both views offer the same ability to manage your event broker service, and can be filtered and searched.
How the event broker service are shown depends on the view you are using, and the sorting method you have selected for that view. Each view offers different sorting options. You can sort either view by clicking the Sort icon ![]() located in the top right corner of Cluster Manager. The sorting options for each view are outlined below:
located in the top right corner of Cluster Manager. The sorting options for each view are outlined below:
- Grid View
- The sort menu offers two categories for organizing the tiles of service: Group By and Sort By.
- Use the options in the Group By category to group the services. The grouping options are:
- None—This is the default option and leaves the list of services ungrouped.
- Service Type—Groups the services according to the type of service.
- Cloud Region—Groups the services on the service list according to the cloud region the services are deployed in.
- User—Groups the services according to the user that created them in alphabetical descending order.
- Creation Date—Groups the services together by creation date in descending order.
- Combine the options in the Sort By category with the Group By options to sort the groupings of services. The sorting options are:
- Old to New—Sort the list by creation time (date and time) from oldest to newest.
- Alphabetical—Sort the services in alphabetical order. If you grouped the services using the Group By options, the sorting is applied to the groupings.
The organizing selections are applied to the list dynamically and the currently selected Group By option appears at the top of the screen.
- Use the options in the Group By category to group the services. The grouping options are:
- List View
- The sort menu offers two categories for organizing the services on the list: Sort By and Sort Order.
- Use the options in the Sort By category to group the services alphabetically by:
- Name—Orders the list by the service name.
- State—Orders the list by the service state.
- Cloud region—Orders the list by the service cloud region.
- Service class—Order the list by the service class size of the service class.
- Owner—Orders the list by service creator.
- Date—Orders the list by creation date of the service.
- Combine the options in the Sort Order category with the Sort By options, to sort the list. The sorting options are:
- Ascending —Sorts the list of services in ascending alphabetical order (A to Z).
- Descending—Sorts the list of services in descending alphabetical order (Z to A).
- Use the options in the Sort By category to group the services alphabetically by:
Detailed Event Broker Service Information
After you have selected an event broker service, you see a page for the service where you can perform various actions.
Depending on the role and permissions you have, you can perform these steps:
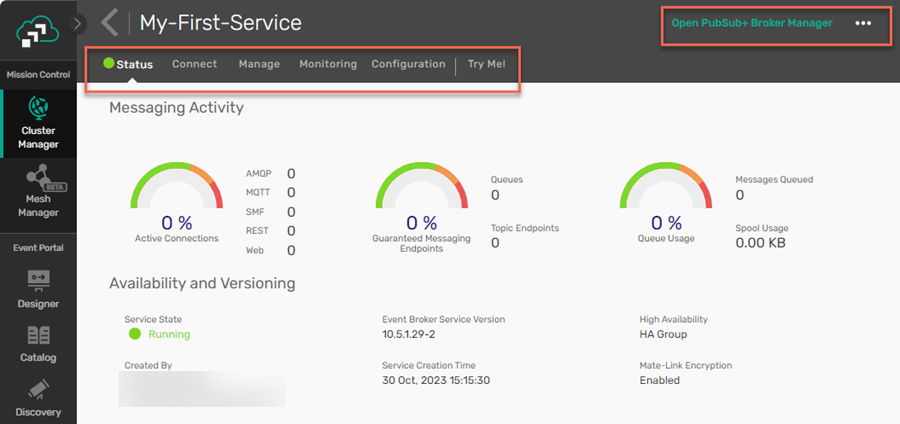
- Click Open Broker Manager to configure a subset of functions on the event broker service. Broker Manager is a web application that runs directly on event broker service and is separate from the Cloud Console. For more information, see
-
View information about the event broker service, manage and configure the service, and test the service using the following tabs:
-
Status: View the overall status and health of your event broker service. You can also view information such as your event mesh details (if the service is part of an event mesh), the service information such as the cluster name/password, the status of authentication schemes used for the event broker service, and login information. You can also view the expiry date of custom TLS server certificates installed using the
Server certificate expiration dates on the Status tab of Cluster Manager are only visible for server certificates installed using the Solace Cloud v2 REST APIs. Server certificates installed using other methods (for example, CLI or by Solace) may not show a date, or may show an invalid date.
- Connect: View management access credentials for your event broker service, or select a language or protocol to view the Messaging Connectivity information for your event broker service.
- Manage: Perform tasks such as configuring queues and managing clients and access.
- Monitoring: If you have Solace Insights, you can see advanced visualizations and graphs to manage and understand the performance of your event broker service.
- Configuration: View the details of the event broker service, such as the cloud provider, region, connection limits, messaging storage, number of queued messages, and maximum message size.
- Try Me!: View connection details for the Broker Manager Try-Me! tool.
-
Finding Event Broker Service Connection Details
When you configure an application to connect to an event broker service, the application requires the client credentials for the service and the service connection details for the protocol and language used.
To find event broker service connection information, perform these steps:
- Log in to the Solace Cloud Console if you have not done so yet. The URL to access the Cloud Console differs based on your
- Select Cluster Manager
 from the navigation bar.
- Select the event broker service that you want to find connection details for. If the event broker service is not listed, make sure you have the right environment selected. For more information, see Selecting Environments.
- Select the Connect tab.
-
In the View by list, select Protocol or Language to sort the connection details and then locate the appropriate library.
You can copy the details you need from the panel that opens.