Monitoring Events Using Syslog
You can use the syslog logging mechanism to monitor event broker events.
Event brokers generate syslog messages, as defined in RFC 3164, to record events that occur on the event broker, such as:
- Routine operations: such as clients connecting and disconnecting, change of command modes
- Failure and error conditions: such as redundant power supply failures
- Emergency or critical conditions: such as a blade taken offline due to excessive temperature
Each syslog message identifies the software process or event broker subsystem that generated the message, and briefly describes the operation or error that occurred.
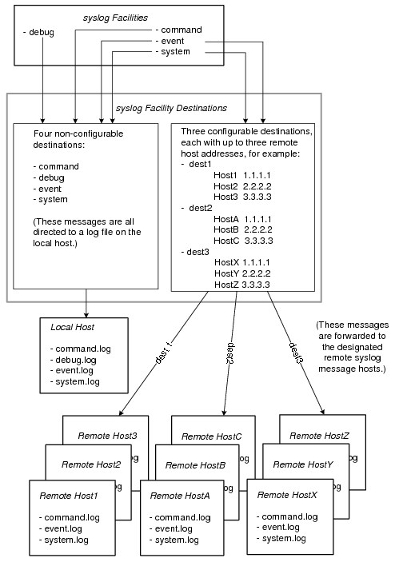
As shown in the figure Syslog Message Flow below, the syslog system offers both the logging of syslog event messages to local files on event brokers, as well as the forwarding of syslog event messages over the network through standard protocols to remote hosts.
A description of syslog messages related to event broker events can be found at Syslog Event Reference.
Syslog Message Format and Components
A syslog message ASCII string consists of:
- a message priority (facility and severity)
- a header (timestamp and host)
- the message string
Each syslog message belongs to a facility, which is a group of messages that are either generated by the same software process, or concern a similar event broker subsystem condition or activity (such as debugging attempts).
Four configurable facility destinations are defined and reserved on the event broker for grouping together related messages from a facility log file: command, debug, event, and system (refer to the table Syslog Facilities below). Syslog message files from the four non‑configurable destinations are all directed to a file on the local syslog message host.
In addition, three configurable facility destinations are available for configuration by users for grouping together related messages from a facility to a log file for forwarding to a remote syslog host.
| Local Syslog Facility | Associated Log | Type of Event or Error |
|---|---|---|
|
local0 |
debug |
Actions performed or errors encountered by debug processes. |
|
local1 |
command |
Actions performed or errors encountered by commands issued at the Solace Event Broker CLI prompt or by CLI script files, or by SEMP. |
|
local3 |
event |
Actions performed or errors encountered by event broker processes, for example, event broker events related to publishers and subscribers, event broker events related to physical links/LAGs, event broker events related to routing protocols, event broker events related to physical hardware. |
|
local4 |
system |
Actions performed or errors encountered by event broker processes that relate to the health of the event broker. The system log is a subset of the event log, where important logs for monitoring systems are duplicated. The majority of SYSTEM_* events are duplicated, along with many VPN_* events that are noteworthy (e.g. HIGH and _CLEAR events). Note that no CLIENT* events are duplicated. |
Each syslog message is also preassigned a severity level, which indicates how seriously the triggering event affects event broker functions. These message event severity levels are defined as an ordered list. The Syslog Message Severity Levels listed below define the message event severity levels, from highest level to lowest.
The associated facility and severity level of a syslog message are together referred to as its priority.
| Severity Level | Description |
|---|---|
|
crit |
Failures causing many or all services in the system to go down. |
|
err |
A service has gone down. An unexpected service outage affecting a small number or single service. |
|
warning |
A service has been degraded or is exceeding expected operating thresholds. |
|
notice |
Normal but significant conditions; for example, service-affecting configuration changes. |
|
info |
Clearing previous raised conditions where no action needs to be taken. |
Events to Monitor to Determine the Health of Event Brokers
Solace recommends that an operations team monitor the events contained in the system syslog (system.log or system facility), as this
syslog contains all events relevant to the health of the event broker. An operations team may also want to monitor some events in the
event.log file depending on the how their messaging network is deployed. For a detailed listing of the possible events and
descriptions of each event, refer to Syslog Event Reference.
Configuring Syslog to Forward Messages
You can use a syslog facility destination on an event broker to group together related messages from a facility to a log file so that it can be forwarded to a remote syslog message host. A maximum of three user-configured syslog destinations are permitted per event broker.
Syslog message files from a user-configured destination are not received by remote syslog message hosts (that is, clients) until hosts are designated and configured. You can configure up to three syslog message hosts for each user-configured syslog destination.
- To create a new syslog facility destination, enter the following command:
solace(configure)# create syslog <name>
To edit the properties of an existing syslog facility destination, enter the following command:
solace(configure)# syslog <name>
Where:
<name>is the name of the user-configured syslog destination. The syslog name can contain up to 31 alphanumeric characters and must be unique among all created syslog destinations.The no version of this command (no syslog) removes the given from the event broker.
For a syslog destination, you can configure the following parameters:
Facility
To add the command, event, or system syslog facility to a user-configured syslog destination, enter the following commands:
solace(configure)# create syslog <name>
solace(configure/syslog)# facility {command | event | system}
Where:
command asks to add the command syslog facility to the user-configured destination
event asks to add the event syslog facility to the user-configured destination
system asks to add the system syslog facility to the user-configured destination
The no version deletes the specified facility from the user-configured destination.
Host
To designate a remote syslog message host as a recipient for syslog files, enter the following commands:
solace(configure)# create syslog <name>
solace(configure/syslog)# host <hostname-or-address> [transport {tcp | udp | tls}]
Where:
<hostname-or-address> is either the name of the remote host, or the IP address with optional port number, specified in the dotted
decimal notation form nnn.nnn.nnn.nnn[:nnn]. UDP port 514 is used as a default if the port number is not provided.
transport {tcp | udp | tls} sets the transport mode used for forwarding the syslog file to the remote host to either TCP, UDP, or TLS,
respectively. UDP is used as a default if this parameter is not provided. If the transport mode is set to TLS, the CA certificates to trust, the
allowed protocol versions, and the cipher suites to accept across the remote rsyslogd TLS connection are specified using the global SSL
CLI commands. For more information, see TLS / SSL Encryption.
The no version of this command (no host) removes the specified host from the user-configured destination.
This CLI command sequence example configures the syslog facility destination named bestlogspotever, adds the command and event
facilities to this user-configured syslog destination, and designates and configures two syslog message hosts for receipt of the forwarded
syslog message file.
solace> enable
solace# configure terminal
solace(configure)# create syslog bestlogspotever
solace(configure/syslog)# facility command
solace(configure/syslog)# facility event
solace(configure/syslog)# host 192.168.1.12 transport tcp
solace(configure/syslog)# host 192.168.1.13 transport tcp
To remove the syslog destination named bestlogspotever once configured, enter:solace(configure)# no
syslog bestlogspotever
Configuring the Message Format for Syslog Facilities
To allow you to more easily understand the contents of log messages, the event broker allows event and system log messages to be emitted from the broker as JSON, with the message arguments in independent JSON properties.
To configure the message format for the event and system syslog facilities, enter the following commands:
solace(configure)# logging
solace(configure/logging)# facility
solace(configure/logging/facility)# {event | system} message-format {text | json}
Where:
event specifies to configure the event syslog facility message format.
system specifies to configure the system syslog facility message format.
text specifies to log message as unstructured text. This is the default value.
json specifies to log message as JSON.
The no form of this command no {event | system} message-format, returns the value to the default.
Log files are not rotated when the format is updated, so at the time of the switch the log file will contain a mix of formats.
JSON Format
When JSON format is enabled, the log message is formatted as JSON (all on a single line) and that JSON is passed to syslog(). The arguments to the log message in Solace Syslog Events is the names of the properties. In addition, the following metadata properties are added at the start of the object in this order:
time — the RFC 3339 timestamp.
solFacility — the Solace name for the syslog facility. Either event or system.
severity — the syslog severity.
host — the hostname.
tag — the event tag.
scope — either VPN, CLIENT, or SYSTEM.
event — the event name, for example CLIENT_CLIENT_DISCONNECT.
vpn — the name of the VPN. Only added if the scope is VPN or CLIENT.
client — the name of the client. Only added if the scope is CLIENT.
raise — an identifier to allow correlation of raise and clear events; also serves to indicate that this event is a raise event. Only
added for raise events.
clear — an identifier to allow correlation of raise and clear events; also serves to indicate that this event is a clear event. Only
added for clear events.
After the metadata, the arguments follow in the order they are defined. A msg property is added at the end with the event text (with
substitutions).
Setting the Maximum Size of JSON Format Syslog Messages
You can set the maximum size of JSON format syslog messages. If the full JSON would exceed that size, properties are dropped or truncated from the
end of the message until the value fits within the specified size with an additional property logIncomplete added with the value
1. Only the msg property is truncated, all other properties are dropped if the full value doesn't fit.
Setting a maximum size is useful because the event broker will remove properties or truncate the value of the msg property, but will
still produce valid JSON. Downstream processes will generally just truncate the log line, resulting in invalid JSON.
To set the maximum size of JSON format syslog messages, enter the following commands:
solace(configure)# logging
solace(configure/logging)# max-json-message-size <max-size>
Where:
<max-size> is the maximum size in bytes of JSON format syslog messages. If a remote syslog destination is configured, the syslog
header is included. The valid range of values is 1024 to 8192. The default value is 8192.
The no version of this command, no max-json-message-size, returns the value to the default.
Viewing Syslog Status
To view the configuration of syslog on your event broker, enter the following command:
solace> show syslog [<name>]
Where:
<name> is the name of the syslog facility destination. Entering no name displays all destinations.
solace> show syslog bestlogspotever
------------------------------------------------
Name: bestlogspotever
Facilities: event command
Files
Hosts                            Transport
  192.168.1.12                   TCP
  192.168.1.13                   TCP
solace> show syslog
------------------------------------------------
Name: command
Facilities: command
Files
  command.log
Hosts                            Transport
------------------------------------------------
Name: debug
Facilities: debug
Files
  debug.log
Hosts                            Transport
------------------------------------------------
Name: event
Facilities: event
Files
  event.log
Hosts                            Transport
------------------------------------------------
Name: system
Facilities: system
Files
  system.log
Hosts                            Transport
------------------------------------------------
Name: scott
Facilities: event command
Files
Hosts                            Transport
  192.168.1.12                   TCP
  192.168.1.13                   TCP
Managing Local Syslog Files
Syslog record files are uncompressed text files that have a <filename>.log.[x] format, where <filename> can be named
after a command, event, system, or debug, and x is an integer from 1 to 20 that identifies the archived file number. The active file is named
<filename>.log with no numeric suffix.
Retrieving Syslog Record Files
Syslog record files are stored locally as uncompressed text files in the /logs subdirectory on the event broker. To retrieve and view
the command log record files, use these CLI commands :
- copy — transfers a text file from the
/logssubdirectory to an external SFTP or SCP server from the event broker.
Example:solace# copy /logs/command.log sftp://john@10.11.12.13/home/john/solacelogs/
- more — directly displays the contents of a text file from the
/logssubdirectory on the event broker.
Example:solace> more /logs/system.log
Logging Capacity
The active syslog record file closes once the file size exceeds 50 MB. Upon closing, a new file opens, and this cycle repeats. The syslog record text
files are in the /logs directory and can be retrieved from event brokers. You can view up to 21 syslog record text files for every
local syslog facility at any given time, including the active log file. To stay within the 21 file limit, when a new log file is created, the oldest
log file is discarded to make space for the new log file. Retention of log files is subject to available disk space. The Solace Software Event Broker caps the space allocated to logs at 1GB.
Syslog record files may contain personal information. To learn more about how to protect this data, see Configuring the Log File Retention Policy.
Directory Maintenance
Because syslog record files are rotated, directory maintenance is not required.
Managing Command Logging
The command logging facility is used to capture information about all event broker commands issued by users through either the Solace Event Broker CLI or the SEMP interface.
Command Log Record Data Example:
2016-05-02T10:24:51.162-05:00 <local1.info> solace1 admin[12694]: CLI/2 192.168.1.217 admin 10:24:47 10:24:48 ok (configure/message-vpn)# max-connections 2000
The information contained in each command log record includes, in order:
- log date and time, for example,
2016-05-02T10:24:51.162-05:00 - syslog destination and level, for example,
<local1.info> - hostname of the event broker, for example,
solace1 - local user name with local process identifier number or pid in square brackets, for example,
admin[12694] - type of event broker interface making the command attempt, for example,
CLIorSEMP: CLI/2 - IP address of host of source of command attempt, for example,
192.168.1.217 - user name assigned to the Solace Event Broker CLI or SEMP user account
- time when command attempt was started, for example,
10:24:47 - time when command attempt finished, for example,
10:24:48 - description of result, that is: ok, command action status, or reason for failure
- command operation attempted:
(configure/message-vpn)# max-connections 2000
Configuring Command Logging
To configure the command logging feature on an event broker, which logs user actions and commands to a viewable command log file, enter the following commands:
solace(configure)# logging
solace(configure/logging)# command {cli | semp-mgmt | semp-msgbus| all} mode {shutdown | config-cmds | all-cmds}
Where:
cli, semp-mgmt, semp-msgbus, or all specify the event broker interface to be logged
shutdown turns off the command logging facility for the specified event broker interface
config-cmds specifies log only configuration commands (not show commands) for the specified event broker interface
all-cmds specifies log all commands except for help (help commands are never logged) for the specified event broker interface
The no version of this command (no command {cli | semp | all}) reverts command logging back to the default mode of logging only
configuration commands for the specified event broker interface (that is, cli, semp-mgmt, semp-msgbus, or
all).
Viewing Command Logging Configuration
To view the configuration of the command logging facility on the event broker, enter the following command:
solace> show logging command
solace> show logging command
Cmd Interface Logging Mode
--------------------------------
CLI config
SEMP/mgmt config
SEMP/msgbus config
Interpreting Client Disconnect Event Logs
Whenever clients are disconnected from the event broker, the event broker reports the reason for the disconnect through a disconnect event log. This log reports the final statistic summary event for the connection.
SMF Client Disconnect Event Log Example
2013-05-06T18:18:56-0400 <local3.info> solace1 event: CLIENT: CLIENT_CLIENT_DISCONNECT: testVpn testHost/17879/#00010001 Client (82) testHost/17879/#00010001 username testUser WebSessionId (N/A) reason(Peer TCP Closed) final statistics - dp(103, 103, 0, 0, 103, 103, 1557, 2373, 0, 0, 1557, 2373, 0, 0, 0, 0, 0, 0, 0, 0, 0, 0) conn(0, 0, 192.168.164.34:58214, CLSWT, 0, 0, 0) zip(0, 0, 0, 0, 0.00, 0.00, 0, 0, 0, 0, 0, 0, 0, 0) web(0, 0, 0, 0, 0, 0, 0), SslVersion(), SslCipher()
MQTT Client Disconnect Event Log Example
2017-07-03T15:59:23+0800 <local3.info> sgdemo1 event: CLIENT: CLIENT_CLIENT_DISCONNECT_MQTT: plant_monitor #mqtt/PLANT_MONITOR_192.168.42.250/71841 Client (1141) #mqtt/PLANT_MONITOR_192.168.42.250/71841 username default ClientId (PLANT_MONITOR_192.168.42.250) reason(Client Disconnect Received) final statistics - dp(2, 1, 1, 0, 3, 1, 80, 4, 238, 0, 318, 4, 0, 0, 0, 0, 0, 0, 0, 0, 0, 0) conn(0, 0, 192.168.42.1:20362, ESTAB, 0, 0, 0) mqtt(1, 1, 0, 1, 0, 0, 0, 0, 0, 0, 0, 0, 0, 0, 0, 0, 0, 1), SslVersion(), SslCipher(), WillSent(0)
The reason entry describes why the client was disconnected:
- (Client Disconnect Received)—Connection dropped because a disconnect notification was received.
- (Document Too Large)—Connection dropped because an incoming message is too large.
- (Forced Logout)—Administrative disconnect or shutdown action triggered either by a client disconnect, or by replacement of duplicate client connections during authentication.
- (Inactive Connection)—Connection dropped due to an inactive network connection.
- (Peer Draining Messages Too Slowly)—Connection dropped due to low throughput while the event broker is under stress. During stressful conditions, the event broker drops connections that are moving too slowly to free up system resources.
- (Peer Host Unreachable)—The event broker is unable to reach the remote host.
- (Peer Refused TCP Connection)—For a connection initiated by the event broker (for example, Message VPN bridging and event broker-to-event broker connections), the peer refused the TCP connection.
- (Peer TCP Closed)—The remote end has gracefully closed the TCP connection.
- (Peer TCP Reset)—The remote end has ungracefully closed the TCP connection.
- (SSL CTX has been expired)—The oldest TLS context (data derived from the server certificate) in the event broker expired. Clients using that TLS context are disconnected.
- (TCP Keep-Alive Failure)—Connection dropped due to a failure on the remote end to respond to a TCP Keepalive probe.
- (Too Many TCP Retransmissions)—Connection dropped due to bad throughput.
Replacement of duplicate client connections during authentication is by default enabled on the event broker. To disable, enter the
following command: solace(configure)# no authentication replace-duplicate-client-connections.
The dp entry lists the following client dataplane statistics, in order:
- Control Messages Received
- Control Message Delivered
- Topic Messages Received
- Topic Messages Delivered
- Total Messages Received
- Total Message Delivered
- Control Bytes Received
- Control Bytes Delivered
- Topic Bytes Received
- Topic Bytes Delivered
- Total Bytes Received
- Total Bytes Delivered
- Current Message Rate at Ingress
- Current Message Rate at Egress
- Average Message Rate at Ingress
- Average Message Rate at Egress
- Denied Duplicate Clients
(Messages Discarded at Ingress due to:)
- No Subscription Match
- Topic Parse Error
- Internal Parse Error
- Message Too Big
(Queue Discards due to:)
- Transmit Congestion
The conn entry lists the following client connection statistics information, in order:
- Received Queue Bytes
- Send Queue Bytes
- Client Address: Port
- State
- Received Out of Order
- Fast Retransmit
- Timed Retransmit
The zip entry lists the following client compression statistics information, in order:
- Compressed Bytes Received
- Compressed Bytes Delivered
- Uncompressed Bytes Received
- Uncompressed Bytes Delivered
- Compression Ratio at Ingress
- Compression Ratio at Egress
- Current Compressed Byte Rate at Ingress
- Current Compressed Byte Rate at Egress
- Current Uncompressed Byte Rate at Ingress
- Current Uncompressed Byte Rate at Egress
- Average Compressed Byte Rate at Ingress
- Average Compressed Byte Rate at Egress
- Average Uncompressed Byte Rate at Ingress
- Average Uncompressed Byte Rate at Egress
The web entry lists the following Web client dataplane statistics information, in order:
- Web Messages Received—total number of HTTP requests received by the event broker for the client session.
- Web Messages Delivered—total number of HTTP responses sent by the event broker for the client session.
- Web Bytes Received—total number of octets in the message bodies of all HTTP requests received by the event broker for the client session.
- Web Bytes Delivered—total number of octets in the message bodies of all HTTP responses sent by the event broker for the client session.
- Web Out Of Order—approximate number of TCP out-of-order reception events detected by the event broker, which occur while the TCP connection is in use by the client session.
- Web Fast Retransmit—approximate number of TCP fast retransmission events initiated by the event broker after receiving duplicate TCP acknowledgments, which occur while the TCP connection is in use by the client session.
- Web Timed Retransmit—approximate number of TCP timed retransmission events initiated by the event broker after not receiving TCP acknowledgments, which occur while the TCP connection is in use by the client session.
The mqtt entry lists the following control packet statistics for MQTT clients, in order:
- CONNECT packets received
- CONNACK packets sent
- CONNACK Errors sent
- PUBREC—Publish Received responses
- PUBLISH—Publish Message packets sent
- PUBACK—Publish Acknowledgements Received
- PUBACK—Publish Acknowledgements sent
- PUBREC—Publish Received packets sent
- PUBREL—Publish Release responses received
- PUBCOMP—Publish Complete responses sent
- SUBSCRIBE—Subscribe to Topics packets received
- SUBACK—Subscribe Acknowledgements sent
- SUBACK—Subscribe Acknowledgement errors sent
- UNSUBSCRIBE—Unsubscribe from Topic packets received
- UNSUBSCRIBE—Unsubscribe from Topic packets sent
- PINGREQ—PING Requests received
- PINGRESP—PING Responses sent
- DISCONNECT—Disconnect notifications received
For information on the various MQTT control packets, see 3 MQTT Control Packets in the MQTT Version 3.1.1 Protocol Conformance document.
Where SslVersion lists the TLS/SSL protocol version used.
Where SslCipher lists the cipher suite used.
Interpreting Flow Event Logs
Whenever a flow is closed or unbound from an endpoint on the event broker, the event broker reports the reason for it through a flow event log. This log reports the final statistic summary event for the flow close or unbind, as applicable.
Flow Close Event Log Example
2015-01-08T09:05:40+0000 <local3.info> lab-128-68 event: CLIENT: CLIENT_CLIENT_CLOSE_FLOW: solace dev214/9997/#00010001 Client (6119) dev214/9997/#00010001 username default Pub flow session flow name 99f5f4aa343a4e77bc45f6b3c4db2946 (8048), publisher id 5949, last message id 565, window size 50, final statistics - flow(0, 0, 0, 0, 0, 0, 0, 0, 0, 0, 0, 0, 0, 0, 0, 0, 0, 0, 0, 0, 0, 0, 0, 0, 565)
The flow entry lists the following flow close statistics, in order:
- Spooling Not Ready
- Out of Order Messages
- Duplicate Messages
- No Eligible Destinations
- Spool Over Quota
- Queue/Topic-Endpoint Over
- Replay Log Over Quota
- Maximum Message Usage Exceeded
- Maximum Message Size Exceeded
- Remote Router Spooling Not Supported
- Spool To ADB Fail
- Spool To Disk Fail
- Errored Message
- Queue Not Found
- Spool Shutdown Discard
- User Profile Deny Guaranteed
- No Local Delivery Discard
- SMF TTL Exceeded
- Publish ACL Denied
- Destination Group Error
- Not Compatible With Forwarding Mode
- Low-Priority-Msg Congestion Discard
- Spool File Limit Exceeded
- Replication Is Standby Discard
- Sync Replication Ineligible Discard
- Messages Received
Descriptions for these flow close statistics can be found in Description of Detailed Spooled Message Statistics.
Flow Unbind Event Log Example
CLIENT: CLIENT_CLIENT_UNBIND: RP dev3-185/30296/00030001/349CSHv5cC Client (66) dev3-185/30296/00030001/349CSHv5cC username solclient_1 Unbind to Flow Id (11), ForwardingMode(StoreAndForward), final statistics - flow(255, 0, 0, 0, 0, 2, 0, 0, 2, 0), isActive(No), Reason(Client issued unbind)
The flow entry lists the following flow unbind statistics, in order:
- Message Spool Window Size
- Used Window
- Unacked Messages
- Low Message ID AckPending
- High Message ID AckPending
- Window Closed
- Message Redelivered
- Message Transport Retransmits
- Message Confirmed Delivered Store and Forward
- Message Delivered Cut Through