The event broker generates Syslog messages, as defined in RFC 3164, to record events related to system health and resource utilization as well as event broker operations. Syslog messages are written to log files on the local system, and can be forwarded over the network to a remote host .
Logging Categories
There are three logging categories:
- Command logs (command.log) - Stores all commands, both CLI and SEMP, sent to the event broker
- Event logs (event.log) - Stores all system, VPN, and client level events generated by the event broker
- System logs (system.log) - Stores important system level events generated by the event broker
There are two more logging categories which don't have associated log files, but are viewable on CLI:
- ACL logs - Tracks the last 1000 ACL related logs
- No Subscription match logs - Tracks the last 1000 no subscription matches for a particular topic
The following commands can be used to view logs via CLI:
show log eventshow log event lines 10show log event find <MyClientName>
The event broker can be configured to propagate command, event, and system logs to a remote Syslog server. For more details, please refer to Monitoring Events Using Syslog.
Syslog Message Severity Levels
Syslogs include actions performed, or errors encountered, by event broker processes. For example, there are events related to publishers and subscribers, physical links/LAGs, the routing protocols CSPF and CSMP, and physical hardware.
Each event broker Syslog message is also preassigned a severity level, which indicates how seriously the triggering event affects event broker functions. These message event severity levels are defined as an ordered list. The following table defines the message event severity levels from highest to lowest. The associated facility and severity level of a Syslog message are together referred to as its priority.
| Severity Level | Description |
|---|---|
|
crit |
Failures causing many or all services in the system to go down. |
|
err |
A service has gone down. An unexpected service outage affecting a small number or single service. |
| warning | A service has been degraded or is exceeding expected operating thresholds. |
| notice | Normal but significant conditions; for example, service affecting configuration changes. |
| info | Clearing previous raised conditions where no action needs to be taken. |
Syslog Message Format and Components
Every event broker Syslog message is created and logged as a plain text ASCII string. Messages are then written to log (ordinary) files, sent to any configured remote Syslog hosts, and displayed to users using standard ASCII string handling operations.
An event broker Syslog message ASCII string consists of:
- a header (timestamp and host)
- a message priority (facility and severity)
- the message string
Event broker Syslog messages belong to a facility, which is a group of messages that are either generated by the same software process, or concern a similar event broker subsystem condition or activity (such as debugging attempts). These are shown in following sections for each of the three Solace event types.
System Events
These events can be detected using the event type "SYSTEM"
Format
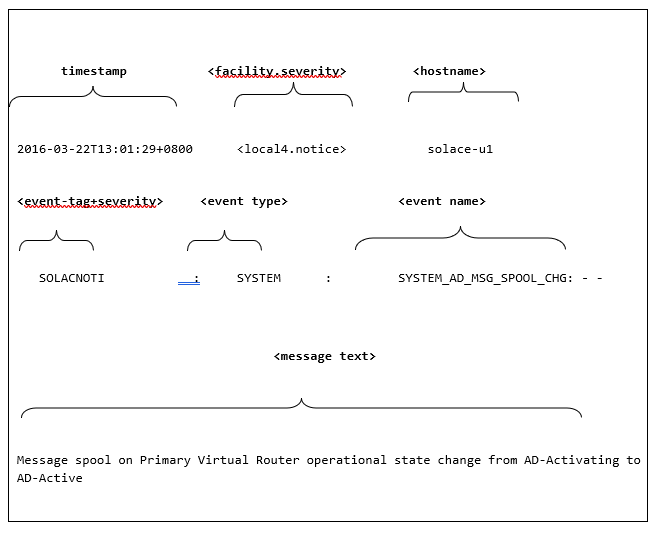
<timestamp> <facility.severity> <hostname> <event-tag+severity>: <event type>: <event name>: - - <message text>
Example
2016-03-22T13:01:29+0800 <local4.notice> solace-u1 SOLACNOTI: SYSTEM: SYSTEM_AD_MSG_SPOOL_CHG: - - Message spool on Primary Virtual Router operational state change from AD-Activating to AD-Active

In the example the system log tag is set to "SOLAC".
Message-VPN Events
These events can be detected using the event type "VPN". The field <vpn-name> can be used to correlate all Message VPN Syslog messages generated for a particular Message VPN.
Format
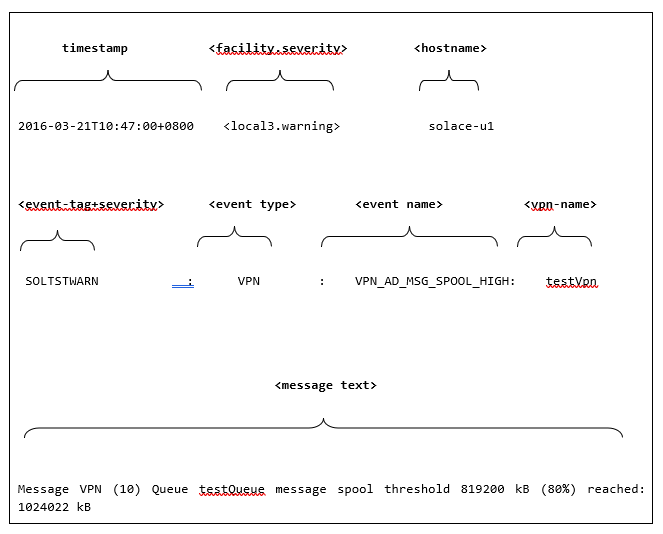
<timestamp> <facility.severity> <hostname> <event-tag+severity>: <event type>: <event name>: <vpn-name> - <message text>
Example
2016-03-21T10:47:00+0800 <local3.warning> solace-u1 SOLTSTWARN : VPN: VPN_AD_MSG_SPOOL_HIGH: testVpn - Message VPN (10) Queue testQueue message spool threshold 819200 kB (80%) reached: 1024022 kB

In the example the message-vpn event log tag is set to "SOLTST".
Client Events
These events can be detected using the event type "CLIENT". The fields <vpn-name> and <client-name> can be used to correlate all client-level Syslog messages generated for a particular Message VPN.
Format
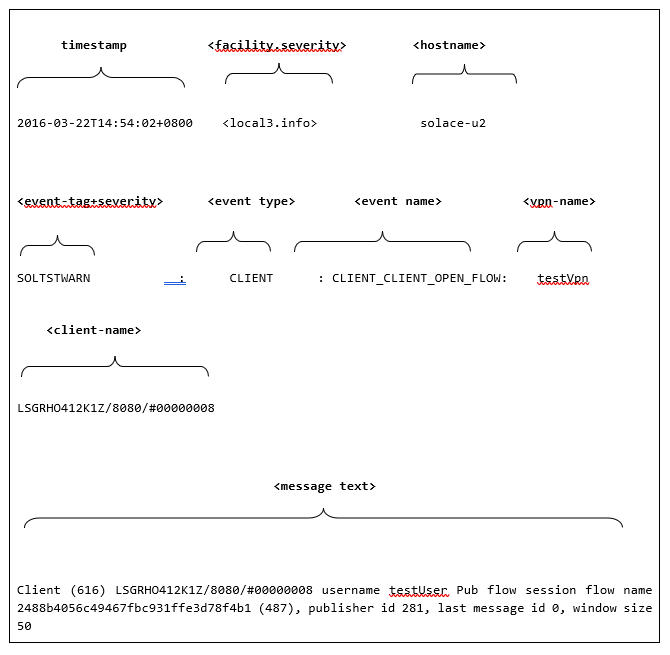
<timestamp> <facility.severity> <hostname> <event-tag+severity>: <event type>: <event name>: <vpn-name> <client-name> <message text>
Example
2016-03-22T14:54:02+0800 <local3.info> solace-u2 SOLTSTWARN: CLIENT: CLIENT_CLIENT_OPEN_FLOW: testVpn LSGRHO412K1Z/8080/#00000008 Client (616) LSGRHO412K1Z/8080/#00000008 username testUser Pub flow session flow name 2488b4056c49467fbc931ffe3d78f4b1 (487), publisher id 281, last message id 0, window size 50

In the example the Message VPN event log tag is set to "SOLTST".
Syslog Timestamp Format
By default, event broker Syslog events are recorded with the following timestamp format:
YYYY-MM-DDTHH:MM:SS+/-HHMM
Where:
<+/-HHMM> is the format of the timezone offset.
Example:
2018-02-09T15:47:52+0500
Sample Syslog Event Entries
Four sample Syslog entries are shown below; the first three are system alerts while the fourth is a client level alert.
2013-02-28T09:32:34-0600 <local3.warning> SOLACELAB1 event: SYSTEM: SYSTEM_NAB_NONCRITICAL_HARDWARE_NOTIFICATION: - - Slot 1/1 Non-critical hardware notification: component NPU-PIP type invalid-frame info 0x00000000000000022013-03-04T11:24:56-0600 <local3.err> SOLACELAB1 event: SYSTEM: SYSTEM_CHASSIS_HARDWARE_SOFT_ERROR: - - Slot 1/3 Hardware soft error detected on TRB FPGA 1 info CRC error is detected in the FPGA configuration2015-08-20T16:28:42+0800 <local3.info> solsg1 event: CLIENT: CLIENT_CLIENT_OPEN_FLOW: TEST_VPN nagiosServer.solacesystems.com/30068/#00000001 Client(2705) username TEST_BRIDGE Pub flow session flow name 71701d48391045209526b4f77f132419 (4352), publisher id 2257, last message id 49063099, window size 5013-03-11T16:47:39-0600 <local3.info> SOLACELAB1 event: CLIENT: CLIENT_CLIENT_DISCONNECT: SOLACEAPP_UAT svc_testbridge_1 Client (385) svc_testbridge_1 username TEST_BRIDGE WebSessionId (N/A) reason(Peer TCP Closed) final statistics - dp(9, 9, 0, 0, 9, 9, 520, 475, 0, 0, 520, 475, 0, 0, 0, 0, 0, 0, 0, 0, 0, 0) conn(0, 0, 10.63.4.161:50203, CLSWT, 0, 0, 0) zip(0, 0, 0, 0, 0.00, 0.00, 0, 0, 0, 0, 0, 0, 0, 0) web(0, 0, 0, 0, 0, 0, 0), SslVersion(), SslCipher()