Viewing Guaranteed Messaging Data Using Broker Manager
You can view data about Queues and Topic Endpoints, as well as about the messages spooled on queues waiting to be consumed.
Although you can view some information about a specific message on an endpoint, the message content is not visible.
This topic includes the following tasks:
Viewing Data for an Endpoint
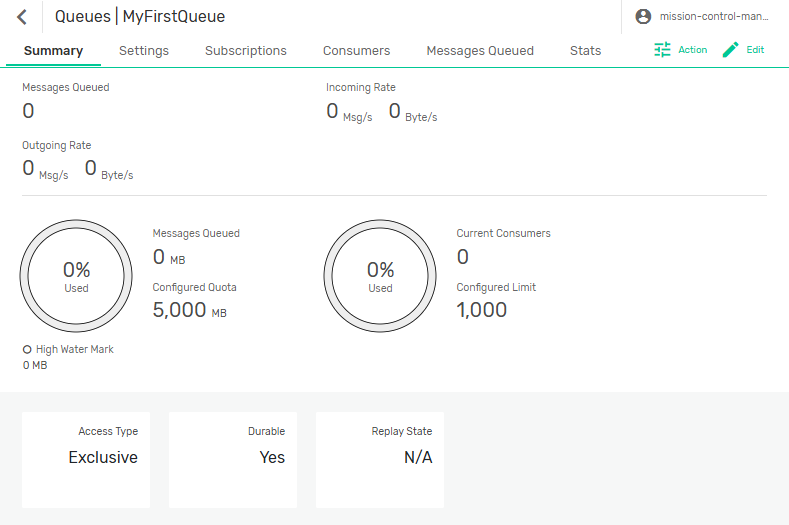
The Summary page displays general information about the activity, spool usage, limits and settings of your queue or topic endpoint. From the tabs on this page you can find detailed information about your endpoint, messages in the queue, subscriptions, and consumers bound to the endpoint.
To view the data for an endpoint, perform these steps:
- Open Broker Manager. For instructions, see Using Broker Manager with Self-Managed Event Brokers.
- Select a Message VPN.
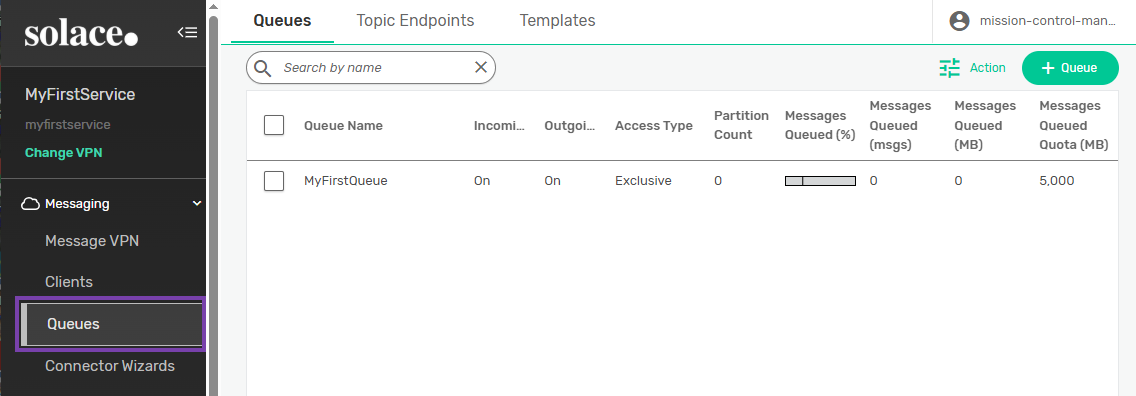
- Select Queues in the left navigation bar.
- Select the Queues or Topic Endpoints tab.
- Click the name of the queue or topic endpoint.
The Summary page for the endpoint displays data about the endpoint, including:- The number of messages currently in the queue and their size, in megabytes.
- The rates of incoming and outgoing messages, in messages per second.
- The amount of message spool being used, in megabytes.
- The number of consumers currently bound to the endpoint.
- The highest amount of message spool, in megabytes, that has been used by the queue at once (high water mark).
- The access type. For more information, see Queue Access Types.
- If the endpoint is durable or temporary. For more information, see Endpoint Durability.
- The replay state of the queue. For more information, see Message Replay.
From this page you can perform several actions:
- Select the Settings tab to view or edit the endpoint settings. For more information, see Configuring Advanced Queue Options or Configuring Topic Endpoints Using Broker Manager.
- (For queues only) Select the Subscriptions tab to view or add topic subscriptions to a queue. For more information, see Adding a Subscription to a Queue.
- Select the Consumers tab to view the clients that are bound to the endpoint.
Viewing Information About Queued Messages
The Messages Queued page displays the message IDs and attachment size for messages currently held in the queue. Messages are removed from the list once they are consumed.
To view information about queued messages, perform these steps:
- Select the Messages Queued tab for the queue or topic endpoint.
- Click the arrow
 next to a message ID to view more information about the message, including:
 - Replication State—Describes if replication is configured for disaster recovery. For more information, see Configuring Replication.
- Expiry Time—Describes the time the message has to be consumed and acknowledged. For more information, see Message Expiry.
- Partition Key/ Partition Key Hash—Determines the destination of messages distributed to partitioned queues. For more information, see Partitioned Queues.
You can copy queued messages to another endpoint using the Solace Event Broker CLI. This feature may be useful for moving a message from a replay log or dead message queue back to the original queue. For more information,
Viewing Endpoint Statistics
To view the statistics for your endpoint, perform these steps:
- Select the Stats tab for the queue or topic endpoint.
- Select one of the following tabs:
- The Stats tab displays numerical data from messages, consumers, and replays, collected throughout the lifetime of the queue. This tab includes:
- Snapshot Statistics—Track the current activity of the endpoint, including the current number and size, in megabytes, of messages in the queue, the number of consumers and topic subscriptions. This section also tracks the highest and lowest values of message spool used (MB), message IDs, and message ID acknowledgments in the queue at one time.
- Cumulative Statistics—Track the cumulative number and size in megabytes of messages stored in the queue at any point since the last time the stats were cleared.
- Incoming Messages Not Queued—Track the number of incoming messages that were not added to the queue and the reason the messages were rejected.
- Messages Removed from Queue—Track the number of messages deleted from the queue and the reason the message was removed.
- Replication Statistics—Track the number of acknowledgment propagation messages sent and received by DR-active and DR-standby sites, and messages acknowledged via acknowledgment propagation or received from an active mate. For more information, see How Replication Works.
- Replay Statistics—Track the number of attempted replays and the number of replayed messages sent and acknowledged. For more information, see Message Replay.
- Consumer Blind Statistics—Track the number of attempted consumer binds to the endpoint, the reasons for failed attempts, and the rate of consumer binding in binds per second.
- Endpoint Data Rates—Track the rates of incoming and outgoing messages in messages per second and bytes per second.
- The Message Priorities tab lists the priorities of the messages, from 0 (lowest) to 9 (highest), that have been sent to the queue. For more information, see Message Priority.
- The Details tab displays information about the endpoint and details about replay logs. This tab includes:
- Replay—Tracks the last time that a replay was started, completed or failed, as well as the state of the last replay and the reason for any failure.
To clear the statistics, click Action ![]() and select Clear Stats.
and select Clear Stats.