If you deploy event broker services to a Customer-Controlled Cluster, you need to allow monitoring data for the event broker services to flow through port 443 to the external centralized monitoring service. The monitoring data is required for these reasons:
- Solace requires the collected monitoring data to effectively manage and maintain the availability of the event broker services.
- The monitoring data provides basic information (configuration and usage) about the event broker services in the Cloud Console. No personal identifiable information is collected.
- Solace Insights uses the monitoring data to build dashboards from historical and real-time data. This information is more granular and the data provided enable better management of your custom applications. Insights is an optional, subscribed service available with Solace Cloud. For more information about Insights, see Insights Overview.
For the monitoring data to flow from your network to the centralized monitoring service, your network must allow event broker services to send outgoing, monitoring traffic to a set of IP addresses. These required IP addresses are configured as part of deployment for security purposes of your private network. For more information, see Deployment Options for Solace Cloud.
Event broker services send monitoring data to the centralized monitoring service using a large set of IP addresses (100+). You (or a network administrator in your organization) are responsible for configuring and maintaining the list of IP addresses in your network that send traffic to the centralized monitoring service. For more information about the IP addresses to use for direct connection mode, see Getting the IP Addresses for Monitoring Traffic.
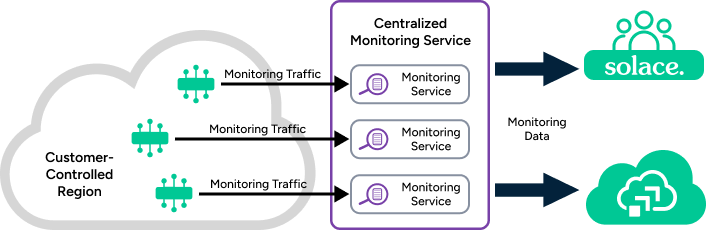
The following diagram illustrates how monitoring traffic flows when sent directly to the centralized monitoring service.
Viewing the Monitoring Traffic Connection Tile
Solace has deprecated the option to set up proxy mode for monitoring traffic in the Cloud Console. The option will be removed from the Cloud Console in the future.
- Log in to the Solace Cloud Console if you have not done so yet. The URL to access the Cloud Console differs based on your
- On the navigation bar, click User & Account
 and then select Account Details.
 -
Select the Account Settings tab.
If Solace Cloud is deployed to a Customer-Controlled Cluster, the Monitoring Traffic Connection tile displays the following options:
- Direct Connection: The only option currently supported
- Proxy: This mode is deprecated
Getting the IP Addresses for Monitoring Traffic
You must coordinate with your network administrator to ensure that outgoing traffic is permitted to the external IP addresses for the centralized monitoring service. There are more than 100 IP addresses that you must allow outgoing monitoring traffic to flow to from your event broker services. Because those IP addresses are dynamic and could change, your network administrator should periodically validate the configured IP addresses against the posted list.
Monitoring traffic is sent directly from the event broker services to the centralized monitoring service (Datadog).
| Regional Home Cloud | IP for Centralized Monitoring Service |
|---|---|
| Australia, Singapore, and United States | https://ip-ranges.datadoghq.com/ |
| European Union | https://ip-ranges.datadoghq.eu/ |
For fully-qualified domain names, you can use the following URLs, based on your regional Home Cloud location:
Australia, Singapore, and United States Home Clouds:
-
api.datadoghq.com -
http-intake.logs.datadoghq.com -
agent-http-intake.logs.datadoghq.com -
*.agent.datadoghq.com -
*.datadog.pool.ntp.org
European Union Home Cloud:
-
api.datadoghq.eu -
http-intake.logs.datadoghq.eu -
agent-http-intake.logs.datadoghq.eu -
*.agent.datadoghq.eu -
*.datadog.pool.ntp.org